
Page 188 - 2020_07-Haematologica-web
P. 188
M. Colombo et al.
apoptotic defenses (Survivin, BCL2) and detoxification ability (ABCC1). Consistently, the treatment of U266-HS5 co-culture system with 50 μM AMD3100 (an antagonist of SDF1 binding to CXCR4), abrogated BMSC-induced resistance to the analyzed drugs (Figure 5I).
Translational potential of approaches inhibiting Jagged-mediated Notch activation in a multiple myeloma microenvironment
We further verified whether the ability of MM cells to promote BMSC-induced drug resistance was dependent on Jagged1 and Jagged2 expression by using primary co- culture systems of highly purified CD138+ MM cells and BMSC isolated from BM aspirates of patients at MM onset (Online Supplementary Table S1).
Primary CD138+ cells were transduced with the lentivi- ral vector pLL3.7 carrying Jagged1/2 shRNAs or Scr shRNAs and the efficiency was assessed by flow cytome- try (Online Supplementary Figure S14). In order to maintain CD138+ cell viability during ex vivo drug administration, after lentiviral transduction, they were co-cultured with primary BMSC stained with PKH26. Co-cultures were maintained for 72 h and treated for the last 24 h with 6 nM Bor (8 patients) or 30 μM Melph (10 patients), or for the last 48 h with 15 μM Len (9 patients) or the corresponding vehicle. The apoptotic rate of MM cells (expressing the GFP codified by the pLL3.7 vector) was detected by flow cytometry analyzing the GFP+/Annexin-V-APC+ subpopu- lation (Figure 6A). Results showed that J1/2KD significant- ly increased apoptosis of primary MM cells treated with
AB
C
5.26%
10.01%
30.28% 65.93%
D
28.27%
16.89%
7.38%
8.07%
50.65%
12.8%
17.08%
38.18%
24.01%
22.71%
52.13%
14.56%
5.8%
34.87%
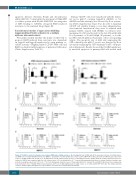
E
Figure 4. J1/2KD is crucial to determine bone marrow (BM)-induced drug resistance. We investigated how J1/2KD affects the molecular outcome of multiple myelo- ma (MM) cells crosstalk with BM stromal cells (BMSC). Quantitative real-time polymerase chain reaction (qRT-PCR) for BCL2, Survivin and ABCC1 gene expression in Scr or J1/2KD OPM2 cells (A) and Scr or J1/2KD U266 cells (B) cultured in the presence of the NIH3T3 cell line. Graphs show the relative expression levels nor- malized to GAPDH and compared with Scr cells cultured alone (=1), calculated by the 2-ΔΔCt formula. Mean±standard deviation are shown. Statistical analysis was performed using two-tailed t-test (*P<0.05; **P<0.01). Histograms show the levels of intracellular BCL2 (C), Survivin (D), and ABCC1 (E) (black lines) analyzed by flow cytometry in Scr or J1/2KD OPM2 cells (left panels) and Scr or J1/2KD (right panels) in single culture or co-cultured with GFP+ HS5 cells. The isotype-matched control is shown in gray. Histograms are representative of at least three independent experiments.
1930
haematologica | 2020; 105(7)
