
Page 221 - Haematologica - Vol. 105 n. 6 - June 2020
P. 221
FHL2 modulates thrombosis formation
groups were testesd by analysis of variance (ANOVA). Data are reported as mean ±standard deviation. P values <0.05 were con- sidered statistically significant.
The P values obtained from the INVENT genome-wide associ- ation study were corrected using the Bonferroni adjustment. In the THE-VTE study, the association of the genotyped SNP with the risk of a first venous thrombosis was assessed by calculating odds ratios (OR) with corresponding 95% confidence intervals (95% CI) adjusted for age and sex, using SPSS (SPSS Inc, Chicago, IL, USA). Analyses were performed in the overall group of patients and after stratification into groups with provoked or unprovoked first venous thrombosis. An unprovoked venous thrombosis was defined as an event in the absence of surgery, plaster cast, injury,
immobilization for more than four consecutive days, hospitaliza- tion, pregnancy or postpartum status, or hormone use in the 3 months prior to the event.37
Results
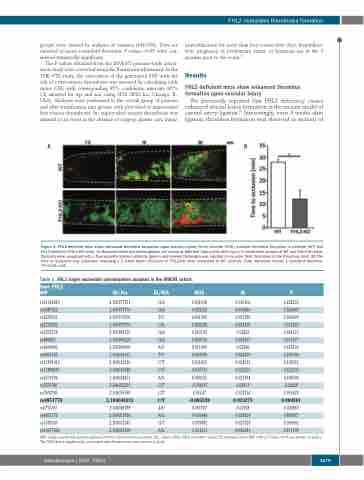
FHL2-deficient mice show enhanced thrombus formation upon vascular injury
We previously reported that FHL2 deficiency causes enhanced arterial lesion formation in the murine model of carotid artery ligation.30 Interestingly, even 4 weeks after ligation, thrombus formation was observed in sections of
AB
Figure 1. FHL2-deficient mice show enhanced thrombus formation upon vascular injury. Ferric chloride (FeCl3)-induced thrombus formation in wildtype (WT) and FHL2-deficient (FHL2-KO) mice. (A) Representative photomicrographs are shown at different time points after injury in mesenteric vessels of WT and FHL2-KO mice. Platelets were visualized with a fluorescently labeled antibody (green) and labeled fibrinogen was injected to visualize fibrin formation in the thrombus (red). (B) The time to occlusion was assessed, revealing a 2.3-fold faster occlusion in FHL2-KO mice compared to WT animals. Data represent means ± standard deviation. *P<0.05; n=8.
Table 1. FHL2 single nucleotide polymorphism analyses in the INVENT cohort.
Gene: FHL2 SNP
rs11124029
Chr:Pos
2:105977761
EA/NEA BETA
G/A 0.032368
SE
0.030102
0.035866
0.023185
0.024195
0.02822
0.024537
0.02346
0.024279
0.024313
0.025252
0.023494
0.02413
0.023114
0.023279
0.02598
0.038529
0.023328
0.025241
P
0.282235
0.525667
0.965399
0.316255
0.641123
0.313577
0.618169
0.207594
0.195951
0.532232
0.694594
0.02028
0.016425
0.000201
0.028863
0.883475
0.090562
0.211709
rs3087523
rs2278501
rs2278502
rs2576778
rs880427
rs4640402
rs4851765
rs11891016
rs11884297
rs4374396
rs2376740
rs1914748
rs4851770 2:106046333 C/T rs6750100 2:106046789 A/G rs4851772 2:106051956 A/G rs7583367 2:106053343 G/T
2:105977776 2:105979506 2:105979730 2:105982753 2:105985228 2:105999009 2:106012632 2:106013216 2:106013248 2:106024451 2:106032291 2:106035580
G/A -0.022763 T/C 0.001005 C/A 0.024248 G/A 0.013155 G/A 0.024726 A/C 0.011695 T/C 0.030595 C/T 0.031439 C/T -0.015773 A/G 0.009225 C/T -0.056017 C/T 0.05547
rs10177620 2:106083368 A/G
-0.086598
0.056783
-0.005646
-0.039482
-0.031521
SNP: single nucleotide polymorphism. Chr:Pos: chromosome: position; EA_ effect allele; NEA: non-effect allele; SE: standard error SNP with a P value <0.05 are shown in italics. The SNP that is significantly associated after Bonferroni correction is in bold.
haematologica | 2020; 105(6)
1679
