
Page 204 - Haematologica - Vol. 105 n. 6 - June 2020
P. 204
S. Stivala et al.
AB
CD
EF
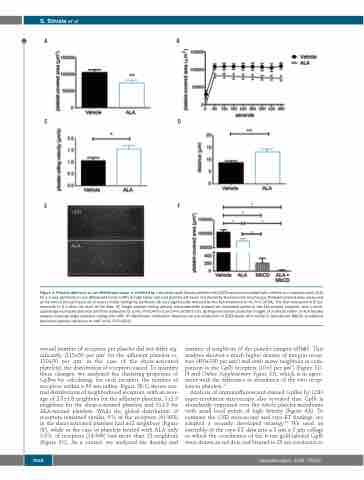
Figure 1. Platelet adhesion to von Willebrand factor is inhibited by α-linolenic acid. Blood collected into EDTA and pre-incubated with vehicle or α-linolenic acid (ALA) for 1 h was perfused on von Willebrand factor (vWF) at high-shear rate and platelet adhesion monitored by fluorescence microscopy. Platelet-covered area measured at the end of the perfusion (A) or every minute during the perfusion (B) was significantly reduced by the ALA treatment (n=6, P=0.0039). The first time-point in B cor- responds to 5 s after the start of the flow. (C) Single platelet rolling velocity measurements showed an increased speed in the ALA-treated samples, and a corre- spondingly increased distance until firm adhesion (D) (n=6, P=0.04 for C and P=0.0009 for D). (E) Representative projection images of a vehicle (VEH)- or ALA-treated sample showing single platelets rolling over vWF. (F) Membrane cholesterol depletion by pre-incubation of EDTA-blood with methyl-β cyclodextrin MbCD) completely abolished platelet adhesion to vWF (n=6, P<0.0001).
overall number of receptors per platelet did not differ sig- nificantly (115±50 per μm2 for the adherent platelets vs. 130±50 per μm2 in the case of the shear-activated platelets), the distribution of receptors varied. To quantify these changes, we analyzed the clustering properties of GpIbα by calculating, for each receptor, the number of receptors within a 50 nm radius. Figure 3E-G shows nor- mal distributions of neighborhood receptors, with an aver- age of 2.5±1.8 neighbors for the adherent platelets, 3±2.3 neighbors for the shear-activated platelets and 3±1.8 for ALA-treated platelets. While the global distribution of receptors remained similar, 9% of the receptors (41/453) in the shear-activated platelets had ≥12 neighbors (Figure 3F), while in the case of platelets treated with ALA only 3.8% of receptors (14/366) had more than 12 neighbors (Figure 3G). As a control, we analyzed the density and
number of neighbors of the platelet integrin αIIbβ3. This analysis showed a much higher density of integrin recep- tors (450±180 per μm2) and with many neighbors in com- parison to the GpIb receptors (10±5 per μm2) (Figure 3D, H and Online Supplementary Figure S3), which is in agree- ment with the difference in abundance of the two recep- tors in platelets.28
Analysis of immunofluorescent-stained GpIbα by GSD super-resolution microscopy also revealed that GpIb is abundantly expressed over the whole platelet membrane with small local points of high density (Figure 4A). To compare the GSD microscopy and cryo-ET findings, we adopted a recently developed strategy.29 We used an assembly of the cryo-ET data into a 5 μm x 5 μm collage in which the coordinates of the 6 nm gold-labeled GpIb were drawn as red dots and blurred to 20 nm resolution to
1662
haematologica | 2020; 105(6)
