
Page 158 - Haematologica - Vol. 105 n. 6 - June 2020
P. 158
J.A. Cohen et al.
To construct a scoring system (hereafter designated as the CRO score) using these five independent predictors, a point value of 1 or 2 was assigned to variables according to their respective normalized hazard ratios as follows: i) 2 points to del17p, and UM IGHV; ii) 1 point to del11q, tris12, and WBC count >32K (Table 1). Then, three risk groups, based on point cut offs of 0 (low risk, 218 cases), 1-2 (intermediate risk, 159 cases), and 3-5 (high risk, 101 cases) were established by recursive partitioning analysis (Online Supplementary Figure S1). The median TFS (95%CI) was 216 m (216-216 m), 104 m (93-140 m) and 58 m (44- 68 m) (P<0.0001) for the low-, intermediate-, and high-risk groups, respectively, with a C-index of 0.75 (Figure 2C). A comparison with the CLL-IPI (possible in 418 of 478 cases with available B2M data) indicated a C-index of 0.76 for the CRO score compared to 0.69 when patient risk groups were split according to the CLL-IPI (P<0.0001) (Online Supplementary Figure S4A).
External validation of the CRO score
The CRO score was then validated in four independent cohorts of Rai 0 CLL; baseline patient characteristics are reported in Online Supplementary Table S1. These cohorts demonstrated similar TFS survival curves when compared to each other and the training series (Online Supplementary Figure S5). Results were as follows (see also Figure 3):
i) the 144 cases of the Gemelli cohort (Figure 3A) had a median (95%CI) follow up of 91 m (83-103 m). Overall, median (95% CI) TFS was 86 m (80-94 m) (Online Supplementary Figure S5), while median (95%CI) TFS for the low- (96 cases), intermediate- (36 cases) and high-risk (12 cases) groups was 239 m (range, 239-239 m), 98 m (92- 132 m) and 85 m (60-109 m), respectively (P=0.002 between low- and intermediate-risk groups, P=0.09 between intermediate- and high-risk groups). In this cohort, the C-indices were 0.64 and 0.61 for the CRO score and the CLL-IPI, respectively (P<0.0001) (Online Supplementary Figure S4B);
ii) the Cardiff cohort (395 cases) had a median (95%CI) follow up of 94 m (83-104 m). Median (95%CI) TFS was 74 m (67-81 m) overall (Online Supplementary Figure S5), and not reached (NR), 111 m (97-146 m) and 70 m (29-114 m) for the low- (206 cases), intermediate- (136 cases), and high-risk (53 cases) groups, respectively (P<0.001 between low- and intermediate-risk groups, P=0.009 between intermediate- and high-risk groups) (Figure 3B); C-index
was 0.63 for both the CRO score and the CLL-IPI (P=not significant, ns) (Online Supplementary Figure S4C);
iii) the Mayo cohort (540 cases) had a median (95%CI) fol- low up of 77 m (68-88 m). Median (95%CI) TFS was 127 m (96 m-NR) overall (Online Supplementary Figure S5), and NR, 76 m (range, 64 m-NR) and 36 m (range, 31-59 m) for the low- (278 cases), intermediate- (168 cases) and high-risk (94 cases) groups, respectively (P<0.0001) (Figure 3C); C-indices were 0.72 and 0.68 for the CRO score and the CLL-IPI, respectively (P<0.0001) (Online Supplementary Figure S4D);
iv) the multicenter O-CLL cohort (322 cases) had a median (95%CI) follow up of 89 m (85-95 m), while medi- an (95%CI) TFS was NR overall (Online Supplementary Figure S5), and NR, 96 m (83-110 m) and 48 m (39-67 m) for the low- (189 cases), intermediate- (84 cases) and high- risk (49 cases) groups, respectively (P<0.001 between low- and intermediate-risk groups, P=0.003 between interme- diate- and high-risk groups; C-index 0.74) (Figure 3D). In the 239 cases with available B2M data, the C-indices were 0.71 and 0.70 for the CRO score and the CLL-IPI, respec- tively (P<0.001) (Online Supplementary Figure S4E).
The composite TFS curve included 1,401 Rai 0 cases by combining cases from the four validation cohorts. Median (95%CI) TFS was 175 m (143-201 m) overall and NR, 106 m (96-134 m) and 45 m (39-60 m) for the low-, intermedi- ate- and high-risk groups, respectively (P<0.0001; C-index 0.69) (Figure 3E). In the 1,318 cases with available B2M data, the C-indices were 0.68 for the CRO score and 0.66 for the CLL-IPI (P<0.0001) (Online Supplementary Figure S6). In this context, AIC was 4,881 for the CRO score ver- sus 4,912 for the CLL-IPI, in keeping with a relative better quality of the former as a TFS predictor.
Sub-analyses of the CRO score high-risk group
By combining the training and four validation cohorts, 309 of 1,879 cases (16%) were identified as having rela- tively higher risk of early progression and treatment according to the CRO score (scores 3, 4 or 5). In this sub- set, the vast majority of cases had a CRO score of 3 (223 cases, 72%) or 4 (72 cases, 23%); however, a small minor- ity of patients (14 cases, 4.5%) had a CRO score of 5, i.e. presented with a WBC count >32K in the context of dis- ease bearing both del17p and an UM IGHV gene status (Online Supplementary Table S2). Although the median TFS of cases with CRO scores 3 and 4 was similar, a signifi- cantly shortened median TFS was demonstrated in
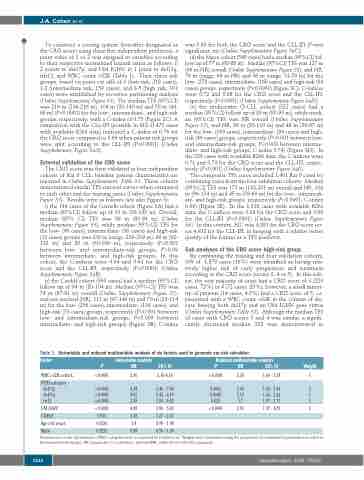
Table 1. Univariable and reduced multivariable analysis of six factors used to generate our risk calculator.
Factor
WBC>32K cells/ L
FISH category del17p del11q
tri12
UM IGHV CD49d+ Age>65 years Male
Univariable analysis Reduced multivariable analysis
P HR 95%CI P HR 95%CI Weight
<0.0001 2.96 2.10-4.16 <0.0001 2.39
1.69 - 3.38 1
1.69 - 5.44 2 1.26 - 3.62 1 1.07 - 2.71 1
1.97 - 4.29 2
<0.0001 4.38 <0.0001 4.02 <0.0001 2.85
<0.0001 4.08 0.001 1.78 0.0536 1.4 0.9232 0.98
2.46 - 7.80 2.45 - 6.19 1.84 - 4.42
2.86 - 5.80 1.27 - 2.51 0.99 - 1.98 0.70 - 1.38
0.0002 3.03 0.0049 2.13 0.025 1.7
<0.0001 2.91
Fluorescence in situ hybridization (FISH) categories were as reported by Dohner et al.7 Weights were determined using the proportion of normalized hazard ratios rounded to the nearest whole integer. HR: hazard ratio; CI: confidence interval; WBC: white blood cell; UM: unmutated.
1616
haematologica | 2020; 105(6)
