
Page 157 - Haematologica - Vol. 105 n. 6 - June 2020
P. 157
Early treatment prediction in Rai 0 CLL
by a next-generation sequencing (NGS) approach, as previously reported.5,23-26 In the case of TP53 mutation, cases were defined as TP53 mutated if the variant allele frequency was >10% according to ERIC recommendations.27
The Cox proportional hazards regression model was chosen to assess the independent effect of co-variables on TFS, with a step- wise procedure for selecting significant variables. All co-variables, apart from FISH categories,7 were treated as dichotomous and evaluated at diagnosis. Independent variables were internally val- idated using bootstrapping procedures and weighted based on the proportion of their normalized hazard ratios (HR) rounded to the nearest whole integer (Table 1). Risk-categories were determined by recursive partitioning (Online Supplementary Figure S1), and Kaplan-Meier analyses were used to generate survival curves.
In the training cohort, five cases died without treatment and were censored at the date of death. A sensitivity analysis for com- petitive risk, conducted on the training cohort according to the Fine-Gray model,28 reported no substantial modification in level of risk (data not shown).
The concordance index (C-index) was used to compare our model with the CLL-IPI11 in 418 of 478 (training cohort), 144 of 144 (Gemelli cohort), 395 of 395 (Cardiff cohort), 540 of 540 (Mayo cohort), 239 of 322 (O-CLL cohort), and 1,318 of 1,401 (composite validation cohort) cases with available B2M data. In all cases, the statistical significance between C-indices was evaluated by apply- ing the Student t-test and internally validated by applying a boot- strapping procedure. The Akaike information criterion (AIC) was also employed as an estimator of the relative quality of the model proposed in this study in comparison to the CLL-IPI as TFS predic- tors. When applicable, P<0.05 was considered statistically signifi- cant. Statistical calculations were made using MedCalc or the open source R package (http://www.r-project.org/) statistics software.
Results
Identification of the training cohort and construction of a scoring system
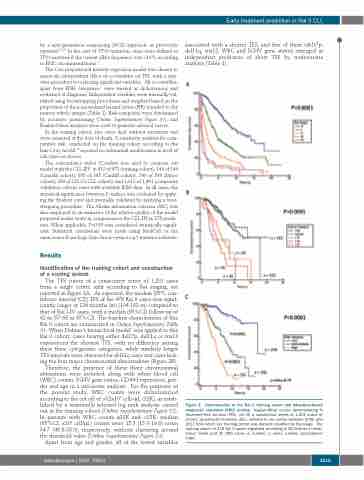
The TFS curves of a consecutive series of 1,201 cases from a single center, split according to Rai staging, are reported in Figure 2A. As expected, the median [95% con- fidence interval (CI)] TFS of the 478 Rai 0 cases was signif- icantly longer at 124 months (m) (104-183 m) compared to that of Rai I-IV cases, with a median (95%CI) follow up of 62 m (57-68 m 95%CI). The baseline characteristics of this Rai 0 cohort are summarized in Online Supplementary Table S1. When Dohner’s hierarchical model7 was applied to this Rai 0 cohort, cases bearing either del17p, del11q or tris12 experienced the shortest TFS, with no difference among these three cytogenetic categories, while similarly longer TFS intervals were observed for del13q cases and cases lack- ing the four major chromosomal abnormalities (Figure 2B).
Therefore, the presence of these three chromosomal aberrations were included, along with white blood cell (WBC) counts, IGHV gene status, CD49d expression, gen- der and age in a univariate analysis. For the purposes of the present study, WBC counts were dichotomized according to the cut off of >32x103 cells/μL (32K), as estab- lished by a maximally selected log rank analysis carried out in the training cohort (Online Supplementary Figure S2). In patients with WBC counts ≤32K and >32K, median (95%CI, x103 cell/μL) counts were 15.3 (15.0-16.8) versus 54.7 (49.8-58.0), respectively, without clustering around the threshold value (Online Supplementary Figure S3).
Apart from age and gender, all of the tested variables
associated with a shorter TFS, and five of them (del17p, del11q, tris12, WBC and IGHV gene status) emerged as independent predictors of short TFS by multivariate analysis (Table 1).
A
B
C
Figure 2. Determination of the Rai 0 training cohort and laboratory-based prognostic calculator (CRO) scoring. Kaplan-Meier curves demonstrating % treatment-free survival (TFS) for (A) a consecutive series of 1,201 cases of chronic lymphocytic leukemia (CLL) referred to our center between 2006 and 2017 from which our training cohort was derived; stratified by Rai stage. The training cohort of 478 Rai 0 cases organized according to (B) Dohner’s hierar- chical model and (C) CRO score. n: number; y: years. c-index: concordance index.
haematologica | 2020; 105(6)
1615
