
Page 129 - Haematologica - Vol. 105 n. 6 - June 2020
P. 129
PTCL classification using RT-MLPA assay
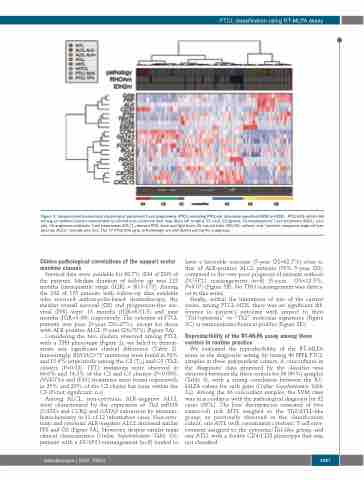
Figure 3. Unsupervised hierarchical clustering of peripheral T-cell lymphomas (PTCL) including PTCL-not otherwise specified (NOS) (n=230). PTCL-NOS distributed among six defined clusters represented by colored bars under the heat map (from left to right): C1 (red), C2 (green), C3 hepatosplenic T-cell lymphoma (HSTL) (pur- ple), C4 angioimmunoblastic T-cell lymphomas AITL/TFH-derived PTCL (blue and light blue), C5 natural killer (NK)-TCL (yellow), and “cytotoxic anaplastic large cell lym- phomas (ALCL)” (orange and red). The 77 PTCL-NOS (gray in Pathology) are distributed among the subgroups.
Clinico-pathological correlations of the support vector machine classes
Survival data were available for 88.7% (204 of 230) of the patients. Median duration of follow up was 122 months [interquartile range (IQR) = 80.5-173]. Among the 132 of 175 patients with follow-up data available who received anthracyclin-based chemotherapy, the median overall survival (OS) and progression-free sur- vival (PFS) were 15 months (IQR=6-51.5) and nine months (IQR=3-36), respectively. The outcome of PTCL patients was poor (5-year OS=27%), except for those with ALK-positive ALCL (5-year OS=70%) (Figure 5A).
Considering the two clusters observed among PTCL with a TFH phenotype (Figure 1), we failed to demon- strate any significant clinical difference (Table 2). Interestingly, RHOAG17V mutations were found in 52% and 15.4% respectively among the C2 (TFH) and C3 (Th2) clusters (P=0.02). TET2 mutations were observed in 60.6% and 14.3% of the C2 and C3 clusters (P=0.039). DNMT3A and IDH2 mutations were found respectively in 25% and 20% of the C2 cluster but none within the C3 (P=not significant, n.s).
Among ALCL, non-cytotoxic ALK-negative ALCL were characterized by the expression of Th2 mRNA (GATA3 and CCR4) and GATA3 expression by immuno- histochemistry in 11 of 12 informative cases. Non-cyto- toxic and cytotoxic ALK-negative ALCL disclosed similar PFS and OS (Figure 5A). However, despite similar main clinical characteristics (Online Supplementary Table S3), patients with a DUSP22-rearrangement (n=8) tended to
have a favorable outcome (5-year OS=62.5%) close to that of ALK-positive ALCL patients (70% 5-year OS), compared to the very poor prognosis of patients without DUSP22 rearrangement (n=8) (5-year OS=12.5%; P=0.07) (Figure 5B). No TP63 rearrangement was detect- ed in this series.
Finally, within the limitations of size of the current series, among PTCL-NOS, there was no significant dif- ference in patient’s outcome with respect to their “Th1/cytotoxic” or “Th2” molecular signatures (Figure 5C) or immunohistochemical profiles (Figure 5D).
Reproducibility of the RT-MLPA assay among three centers in routine practice
We evaluated the reproducibility of the RT-MLPA assay in the diagnostic setting by testing 40 FFPE PTCL samples in three independent centers. A concordance in the diagnostic class proposed by the classifier was observed between the three centers for 36 (90%) samples (Table 3), with a strong correlation between the RT- MLPA values for each gene (Online Supplementary Table S4). Among the 36 concordant samples, the SVM class was in accordance with the pathological diagnosis for 32 cases (89%). The four discrepancies consisted of two tumor-cell rich AITL assigned to the Th2/ATLL-like group, as previously observed in the classification cohort, one AITL with a prominent cytotoxic T-cell envi- ronment assigned to the cytotoxic/Th1-like group, and one ATLL with a double CD4/CD8 phenotype that was not classified.
haematologica | 2020; 105(6)
1587
