
Page 122 - Haematologica - Vol. 105 n. 6 - June 2020
P. 122
A. Touzart et al.
Table 1. Patients’ characteristics and outcome according to methylation status.
A
TCR subsets analyzed Immature (IM0. IMδ. IMγ) IMβ/pre-αβ
TCRαβ+
TCRγδ+
ETP immunophenotype
NOTCH1/FBXW7mutated
High Risk Classifier*
Oncogenetic Category
TLX1
TLX3
SIL-TAL1 CALM-AF10
None of the above
HOXA deregulation
Clinical Subsets Analyzed
Age, median (range)
Sex ratio, M/F WBC(G/L),median(range) 80(4-604)
Low methylation N=42 (Q1)
Int/High methylation P† N= 126 (Q2-Q4)
32/111 (29%) 0.04 60/111 (54%) 0.99
5/111 (5%) <0.0001 14/111 (13%) 0.12
26/110 (24%) 0.1 99/126 (79%) <0.0001 43/125 (34%) 0.0001
35/120 (29%) <0.0001 21/120 (18%) 0.0022
4/36 (11%) 20/36 (56%) 11/36 (31%) 1/36 (3%)
4/37 (11%) 18/42 (43%) 29/42 (69%)
0/41 (0%)
0/41 (0%) 16/41 (39%) 0/41 (0%) 25/41 (61%)
3/39 (8%)
2/120 (2%) <0.0001 B
CNS involvement
Early Response Prednisone response Bone marrow response Complete remission MRD (TP1) <10-4
Long-term outcome 5-year CIR (95% CI) 5-year OS (95% CI)
7/42 (17%)
23/42 (55%) 29/39 (74%) 38/42 (90%) 16/19 (84%)
45% (31-62)
50% (34-64)
23.2 (16.6-56.2) 35/7
8/120 (7%) 0.2 54/120 (45%) 0.1
40/112 (36%) 0.0008 33.4 (16.3-59.1) <0.001
85/41 0.05 30(1-645) 0.003
17/126 (13%) 0.616
68/126 (55%) 1 66/126 (52%) 0.02 117/126 (93%) 0.739
48/73 (66%) 0.164 27% (20-36) 0.04
68% (59-76) 0.03
IM: immature; WBC (g/L): white blood cells; CNS: central nervous system; MRD (TP1): post- induction minimal residual disease; CIR: cumulative incidence of relapse; OS: overall survival; 95%CI:95%confidenceinterval;TCR:T-cellreceptor;ETP:earlythymicprecursor.*Theunfavor- ableclassifierincludesNOTCH1,FBXW7,RASandPTEN(Trinquand,etal.2013).†χ2 orMann- Whitney tests were used where appropriate.
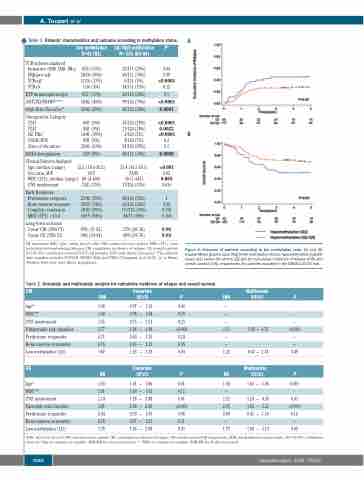
Figure 4. Outcome of patients according to the methylation ratio. (A) and (B) Kaplan-Meyer graphs according to the methylation status, hypomethylated (hypoM) cases (Q1) versus the others (Q2-Q4) for cumulative incidence of relapse (CIR) and overall survival (OS), respectively, for patients included in the GRAALL03-05 trial.
Table 2. Univariate and multivariate analysis for cumulative incidence of relapse and overall survival.
CIR Univariate SHR 95%CI
P SHR 0.90 −
0.29 −
0.23 − <0.001 3.53 0.24 −
0.35 − 0.04 1.25
P HR 0.01 1.04
0.12 −
0.01 2.32 <0.001 2.93 0.08 0.69
0.31 −
0.03 1.79
Multivariate
95%CI P
-
-
Multivariate
95%CI P
1.02 − 1.06 0.001 -
1.24 − 4.35 0.01
Age* 1.00
WBC** 1.00 CNS involvement 1.55 Unfavorable risk classifier 3.77 Prednisone responder 0.71 Bone marrow responder 0.76 Low methylation (Q1) 1.87
0.97 − 1.03 0.98 − 1.04 0.75 − 3.21 2.04 − 6.98 0.40 − 1.25 0.43 − 1.35 1.03 − 3.38
- <0.001 − −
1.85 − 6.73
0.67 − 2.34 0.49
OS Univariate HR 95%CI
Age* 1.03
WBC** 1.01 CNS involvement 2.14 Favorable risk classifier 3.81 Prednisone responder 0.64 Bone marrow responder 0.78 Low methylation (Q1) 1.78
1.01 − 1.06 1.00 − 1.03 1.18 − 3.88 2.24 − 6.50 0.39 − 1.05 0.47 − 1.27 1.06 − 2.98
1.65 − 5.21
0.41 − 1.16 0.16
−
1.00 − 3.19 0.05
<0.001
WBC: white blood cell; CNS: central nervous system; CIR: cumulative incidence of relapse; OS: overall survival; HR: hazard ratio; SHR: sub-distribution hazard ratio; 95% CI: 95% confidence interval. *Age as continuous variable, SHR/HR for 1-year increment. ** WBC as continuous variable, SHR/HR for 10 g/L increment
1580
haematologica | 2020; 105(6)
