
Page 91 - Haematologica May 2020
P. 91
Platelet vesicles and monocyte interaction
anti-P-selectin antibody inhibited GPIbα accumulation on both monocytes and neutrophils, strongly implicating this platelet receptor in heterotypic adhesion with the two cells (Figure 4A and Online Supplementary Figure S9A- B). We measured the density of the P-selectin counter receptor P-selectin Glycoprotein Ligand 1 (PSGL-1) on blood leukocytes because the efficiency of GPIbα accu- mulation might reflect the surface density of this mole- cule. Figure 4B shows that there is substantially more PSGL-1 on monocytes than neutrophils, which could account for the differential levels of GPIbα accumulating on these cells. However, T cells, which did not accumu- late GPIbα, also possessed abundant PSGL-1. Thus addi- tional and cell specific adhesive interactions may be
A
required to stabilise P-selectin mediated adhesion under shear. Using a panel of function-neutralising antibodies against known platelet and leukocyte adhesion mole- cules, we could find no contribution to heterotypic aggre- gate formation from CD31, ICAM-2 or β2-integrins (Figure 4C-E). However, an anti-phosphatidylserine (PS) antibody significantly reduced GPIbα accumulation on both neutrophils and monocytes (Figure 4C-E). The func- tion of PS as a stabilising interactant is concordant with its documented patterns of interaction with monocytes and neutrophils, while its potential lack of interaction with T cells would account for the lack of GPIbα accumu- lation on these cells.
An important question was whether monocyte activa-
BC
D
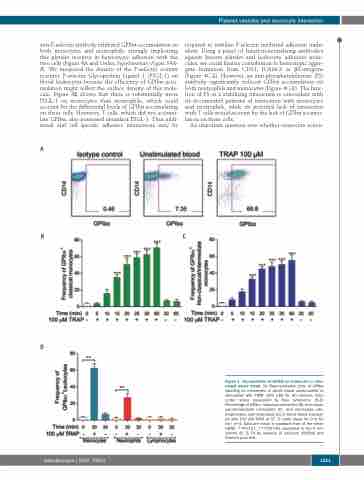
Figure 1. Accumulation of GPIbα on leukocytes in stim- ulated whole blood. (A) Representative plots of GPIbα labelling on monocytes in whole blood unstimulated or stimulated with TRAP (100 mM) for 60 minutes (min) under shear measured by flow cytometry. (B-D) Percentage of GPIbα+ classical monocytes (B), non-classi- cal/intermediate monocytes (C), and monocytes (all), lymphocytes and neutrophils (D) in whole blood stimulat- ed with 100 mM TRAP at 37°C under shear for 0 to 60 min, n=3. Data are mean ± standard error of the mean (SEM). **P≤0.01, ***P≤0.001 compared to the 0 min control (B, C, D) by analysis of variance (ANOVA) and Dunnett post-test.
haematologica | 2020; 105(5)
1251
