
Page 51 - Haematologica May 2020
P. 51
EGR1 regulation of human BMSC
reduced proliferation of EGR1 over-expressing cells. These data therefore indicate that increased prolifera- tion of EGR1 knockdown cells is, at least partly, mediated by increased ROS levels and downregulation of cell death genes, whereas downregulation of cell proliferation and apoptosis inhibiting genes was observed upon EGR1 over- expression. Thus, whereas increased EGR1 expression improved the stroma supporting function of BMSC, cell proliferation was substantially inhibited, indicating a dual role of EGR1 in the regulation of BMSC growth and func- tion. On the other hand, other BMSC functions, such as multi-differentiation capacity (adipogenic, osteogenic and
chondrogenic) and surface marker expression profile of BMSC were not affected by changes in EGR1 expression (Online Supplementary Figure S6A and B).
Discussion
Bone marrow is the major site of residence of both HSC and BMSC. The most crucial functions of BMSC are to maintain the turnover of the BM stroma and skeletal tis- sues and to provide critical hematopoietic support. However, the mechanisms that regulate these different
ABC
DEF
GHI
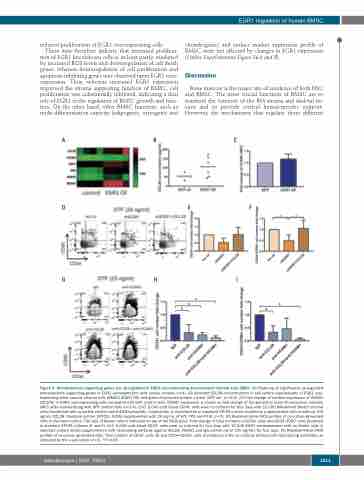
Figure 4. Hematopoiesis-supporting genes are up-regulated in EGR1 over-expressing mesenchymal stromal cells (MSC). (A) Heatmap of significantly up-regulated hematopoietic supporting genes in EGR1 overexpression cells versus controls (n=4). (B) Secreted CCL28 concentrations in cell culture supernatants of EGR1 over- expressing bone marrow stromal cells (BMSC) (EGR1 OE) and green fluorescent protein control (GFP ctr) (n=2-6). (C) Fold change of surface expression of VCAM1 (CD106) in EGR1 over-expressing cells compared with GFP control cells. VCAM1 expression is shown as fold change of the geometric mean fluorescence intensity (MFI) after standardizing with GFP control cells (n=3-4). (D-F) 5,000 cord blood CD34+ cells were co-cultured for four days with 10,000 BM-derived feeder stromal cells transfected with scramble control and shEGR1 plasmids, respectively, in cytokine-free or standard STF25 culture conditions supplemented with or without 100 ng/mL CCL28. Standard culture (STF25): SFEM supplemented with 25 ng/mL of SCF, TPO and Flt3L (n=3). (D) Representative FACS profiles of co-culture generated cells in standard culture. The type of feeder cells is indicated on top of the FACS plots. Fold change of total numbers of CD34+ cells and CD34+CD90+ cells produced in standard STF25 cultures (E and F). (G-I) 5,000 cord blood CD34+ cells were co-cultured for four days with 10,000 EGR1 overexpression cells as feeder cells in standard culture media supplemented with neutralizing antibody against CCL28, VCAM1 and IgG control (all at 100 ng/mL) for four days. (G) Representative FACS profiles of co-culture generated cells. Total number of CD34+ cells (H) and CD34+CD90+ cells (I) produced in the co-cultures without/with neutralizing antibodies as indicated by the x-axis labels (n=3). *P<0.05
haematologica | 2020; 105(5)
1211
