
Page 195 - Haematologica May 2020
P. 195
miR-146b in T-LGL Leukemia patients
According to our published data,5 RT-qPCR analysis showed that FasL mRNA expression correlates with the degree of STAT3 activation (P=0.762, P=0.0368) (Figure 4A) and simultaneously inversely correlates with ANC (P=-0.727, P=0.0096) (Figure 4B). Most importantly, an inverse correlation between miR-146b and FasL mRNA expression (Figure 4C) and the release of soluble FasL (sFasL) (Figure 4D) were detected. Consistently, FasL mRNA expression was higher in CD8 T-LGLL patients (MNE 0.0306±0.0067) compared to the non-neutropenic patients belonging to the CD4 T-LGLL subset (MNE 0.0119±0.0026, P=0.02) (Figure 4E). Interestingly, no dif- ference in the level of FasL primary transcript (FasL-PT) expression between CD8 and CD4 T-LGLs was observed (Figure 4E), suggesting that a mechanism controlling FasL expression at a post-transcriptional level is defective in CD8 T-LGLL subset, that therefore display higher levels of FasL mRNA as compared to CD4 T-LGLL subset.s
In order to demonstrate that miR146b and FasL expres- sion were causally linked, miR-146b was overexpressed in Jurkat and the level of FasL mRNA was analyzed 48 h post transfection. miR-146b-overexpressing cells have reduced levels of FasL mRNA (MNE 2×10⁻⁵±5.77×10⁻⁶) compared to cells transfected with a scramble control miRNA (MNE 3.67×10⁻⁵±6.67×10⁻⁶) (Figure 5A), suggesting a role of miR- 146b in the regulation of FasL expression. Nevertheless, in silico miR-target prediction analysis performed by seven different target prediction software (microT4, miRanda, Pictar2, PITA, RNA22, miRWalk and TargetScan) did not identify FasL among the putative miR-146b target genes, thus suggesting that miR-146b eventually affects FasL expression indirectly, by targeting genes involved in FasL mRNA stability. Among the sixteen genes retrieved as putative miR-146b targets commonly predicted by all soft- ware only one, namely the ribonucleoprotein Human Antigen R (HuR, also known as ELAVL1), plays a well-
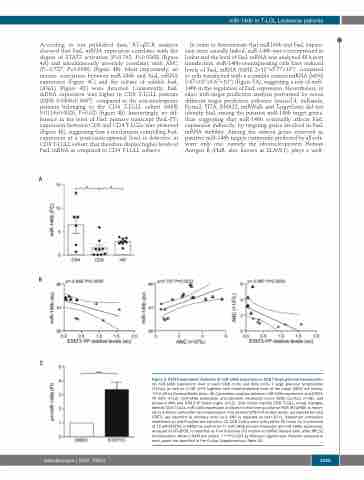
A
B
C
Figure 2. STAT3-dependent inhibition of miR-146b expression in CD8 T large granular lymphocytes. (A) miR-146b expression level in each CD8 (n=9) and CD4 (n=6) T large granular lymphocytes (T-LGLs) as well as in HD (n=9) together with mean±standard error of the mean (SEM) are shown. *P<0.05 by Kruskal-Wallis tests. (B) Correlation analysis between miR-146b expression and STAT3- YP (left, n=12), miR-146b expression and absolute neutrophil count (ANC) (central, n=18), and between ANC and STAT3-YP levels (right, n=12). Grey circles identify CD8 T-LGLs, empty triangles identify CD4 T-LGLs. miR-146b expression analyzed in real-time quatitative PCR (RT-qPCR) is report- ed as arbitrary units after U6 normalization. The relative STAT3-YP protein levels, normalized for total STAT3, are reported as arbitrary units (au). ANC is reported as cell×109/L. Spearman correlation coefficient (p) and P-values are reported. (C) CD8 T-LGLs were cultured for 24 hours (h) in presence of 15 mM STATTIC or DMSO as control (n=7). miR-146b primary transcript (pri-miR-146b) expression, analyzed by RT-qPCR, is reported as Fold Induction (FI) relative to DMSO treated cells, after RPL32 normalization. Mean ± SEM are shown. ***P<0.001 by Wilcoxon signed-rank. Patients analyzed in each panel are specified in the Online Supplementary Table S5.
haematologica | 2020; 105(5)
1355
