
Page 121 - Haematologica May 2020
P. 121
MDM2 and BCR-ABL1 inhibition targets CML stem cell
end of the 4-week treatments, BM and spleen cells were collected (n=3-5 from each group) and leukemia hematopoiesis was analyzed. Flow cytometry analysis showed that the number of GFP+LSK cells was significant- ly reduced in the BM in all treatment groups compared to controls (Figure 4B). The combination was the most effec- tive (P=0.002 vs. control; GFP+LSK cell numbers in combi- nation was 14.9% of that in control group) and was statis- tically significantly better than imatinib alone (P=0.037) (Figure 4B). The combination also statistically significantly decreased the number of GFP–LSK cells (P=0.026 vs. con- trol), but to a much lesser degree, and GFP–LSK cells in the combination treated group was 38.5% of that in the con-
trol, suggesting that a therapeutic window exists for the respective treatments (Online Supplementary Figure S1A).
We determined the levels of p53 and its target proteins in the LSK cell population by CyTOF mass cytometry and observed some increases in these proteins, particularly sig- nificant increases of NOXA in the combination group and BAX in the DS-5272-treated group (Figure 4B). BAX level was also increased in the combination group, but did not reach statistical significance (Figure 4B). Imatinib and the combination also statistically significantly decreased the number of GFP+ WBC, common myeloid progenitor (CMP) cells, and mature myeloid cells, and granulocyte- monocyte progenitor (GMP) cells were not significantly
A
B
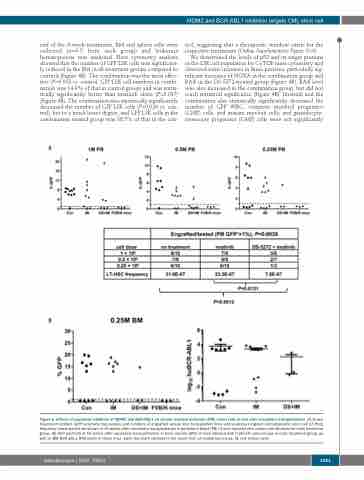
Figure 6. Effects of combined inhibition of MDM2 and BCR-ABL1 on chronic myeloid leukemia (CML) stem cells in vivo after secondary transplantation. (A) Green fluorescent protein (GFP) positivity (top panels) and numbers of engrafted versus total transplanted mice and leukemia long-term hematopoietic stem cell (LT-HSC) frequency (lower panel) are shown at 16 weeks after secondary transplantation in peripheral blood (PB) of mice injected with various cell dilutions for each treatment group. (B) GFP positivity at 16 weeks after secondary transplantation in bone marrow (BM) of mice injected with 0.25x10⁶ cells/mouse in each treatment group, as well as BM BCR-ABL1 RNA levels in these mice. Each dot/mark represents the result from an individual mouse. M: one million cells.
haematologica | 2020; 105(5)
1281
