
Page 319 - Haematologica April 2020
P. 319
Evaluating Netherlands’ transition from FFP to SD plasma
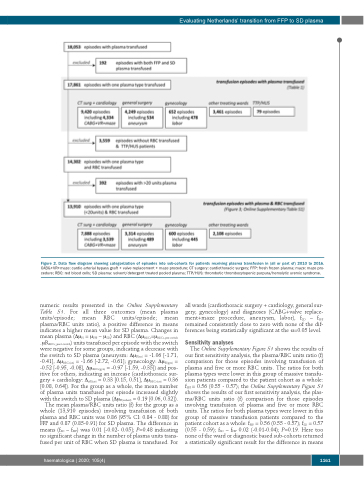
Figure 2. Data flow diagram showing categorization of episodes into sub-cohorts for patients receiving plasma transfusion in (all or part of) 2010 to 2016.
CABG+VR+maze: cardio arterial bypass graft + valve replacement + maze procedure; CT surgery: cardiothoracic surgery; FFP: fresh frozen plasma; maze: maze pro- cedure; RBC: red blood cells; SD plasma: solvent/detergent treated pooled plasma; TTP/HUS: thrombotic thrombocytopenic purpura/hemolytic uremic syndrome.
numeric results presented in the Online Supplementary Table S1. For all three outcomes (mean plasma units/episode; mean RBC units/episode; mean plasma/RBC units ratio), a positive difference in means indicates a higher mean value for SD plasma. Changes in mean plasma (∆μPl = μFFP – μSD) and RBC (∆μRBCs=μRBCs_pre-switch – μRRBCs_post-switch) units transfused per episode with the switch were negative for some groups, indicating a decrease with the switch to SD plasma (aneurysm: ∆μPl(an) = -1.06 [-1.71, -0.41], ∆μRBCs(an) = -1.66 [-2.72, -0.61]; gynecology: ∆μPl(gyn) = -0.52 [-0.95, -0.08], ∆μRBCs(gyn) = -0.97 [-1.59, -0.35]) and pos- itive for others, indicating an increase (cardiothoracic sur- gery + cardiology: ∆μPl(cts) = 0.33 [0.15, 0.51], ∆μRBCs(cts) = 0.36 [0.08, 0.64]). For the group as a whole, the mean number of plasma units transfused per episode increased slightly with the switch to SD plasma (∆μPl(cohort) = 0.19 [0.06, 0.32]).
The mean plasma/RBC units ratio (f) for the group as a whole (13,910 episodes) involving transfusion of both plasma and RBC units was 0.86 (95% CI: 0.84 - 0.88) for FFP and 0.87 (0.85-0.91) for SD plasma. The difference in means (fSD – fFFP) was 0.01 [-0.02- 0.05]; P=0.48 indicating no significant change in the number of plasma units trans- fused per unit of RBC when SD plasma is transfused. For
all wards (cardiothoracic surgery + cardiology, general sur- gery, gynecology) and diagnoses (CABG+valve replace- ment+maze procedure, aneurysm, labor), fSD – fFFP remained consistently close to zero with none of the dif- ferences being statistically significant at the α=0.05 level.
Sensitivity analyses
The Online Supplementary Figure S1 shows the results of our first sensitivity analysis, the plasma/RBC units ratio (f) comparison for those episodes involving transfusion of plasma and five or more RBC units. The ratios for both plasma types were lower in this group of massive transfu- sion patients compared to the patient cohort as a whole: fFFP = 0.56 (0.55 - 0.57); the Online Supplementary Figure S1 shows the results of our first sensitivity analysis, the plas- ma/RBC units ratio (f) comparison for those episodes involving transfusion of plasma and five or more RBC units. The ratios for both plasma types were lower in this group of massive transfusion patients compared to the patient cohort as a whole: fFFP = 0.56 (0.55 - 0.57); fSD = 0.57 (0.55 - 0.59); fSD – fFFP 0.02 (-0.01-0.04); P=0.19. Here too none of the ward or diagnostic based sub-cohorts returned a statistically significant result for the difference in means
haematologica | 2020; 105(4)
1161
