
Page 318 - Haematologica April 2020
P. 318
N.H. Saadah et al.
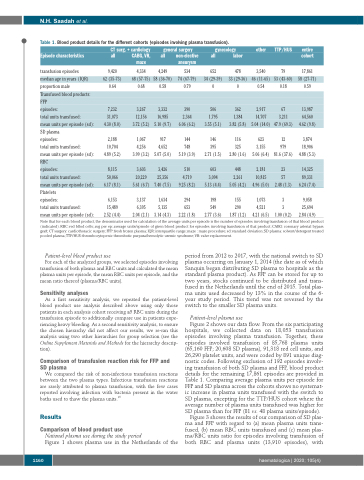
Table 1. Blood product details for the different cohorts (episodes involving plasma transfusion).
Episode characteristics
transfusion episodes
median age in years (IQR) proportion male Transfused blood products: FFP
episodes:
total units transfused:
mean units per episode (sd): SD plasma
episodes:
total units transfused:
mean units per episode (sd): RBC
episodes:
total units transfused:
mean units per episode (sd): Platelets
episodes:
total units transfused:
mean units per episode (sd):
CT surg. + cardiology
general surgery
gynecology
other
3,540
46 (11-65) 0.54
2,917 14,707 5.04 (14.0)
623 3,155 5.06 (6.4)
2,181 10,815 4.96 (5.0)
1,073
4,521
4.21 (6.5)
TTP/HUS
79
53 (43-60) 0.18
67 3,211 47.9 (69.3)
12 979 81.6 (37.6)
23
57
2.48 (1.3)
3
3
1.00 (0.2)
entire cohort
17,861
58 (27-71) 0.59
13,987
64,560
4.62 (9.8)
3,874 18,906 4.88 (5.3)
14,325
89,331
6.24 (7.4)
9,058
25,694
2.84 (4.9)
all
9,420
62 (35-73) 0.64
7,232 31,073 4.30 (8.0)
2,188 10,704 4.89 (5.2)
8,115 50,066 6.17 (8.1)
6,153
15,489
2.52 (4.4)
CABG, VR, maze
4,334
68 (57-75) 0.68
3,267 12,156 3.72 (5.2)
1,067
4,256 3.99 (3.2)
3,603 20,229 5.61 (6.7)
3,137
6,395
2.04 (2.1)
all
4,249
58 (36-70) 0.58
3,332 16,985 5.10 (9.7)
917 4,652 5.07 (5.0)
3,426 25,356 7.40 (7.5)
1,634
5,135
3.14 (4.3)
non-elective aneurysm
534
74 (67-79) 0.79
390 2,364 6.06 (6.2)
144
748 5.19 (3.9)
510 4,719 9.25 (8.2)
294
653
2.22 (1.8)
all
652
34 (29-39) 0
506 1,795 3.55 (5.1)
146
395 2.71 (1.5)
603 3,094 5.13 (4.4)
198
549
2.77 (3.6)
labor
478
33 (29-36) 0
362 1,384 3.82 (5.8)
116
325 2.80 (1.6)
448 2,261 5.05 (4.2)
155
290
1.87 (1.2)
Note that for each blood product, the denominator used for calculation of the average units per episode is the number of episodes involving transfusion of that blood product (indicated). RBC: red bllod cells; avg per ep: average units/episode of given blood product for episodes involving transfusion of that product; CABG: coronary arterial bypass graft; CT surgery: cardiothoracic surgery; FFP: fresh frozen plasma; IQR: interquartile range; maze : maze procedure; sd: standard deviation; SD plasma: solvent/detergent treated pooled plasma;TTP/HUS:thrombocytopenic thrombotic purpura/hemolytic uremic syndrome;VR:valve replacement.
Patient-level blood product use
For each of the analyzed groups, we selected episodes involving transfusion of both plasma and RBC units and calculated the mean plasma units per episode, the mean RBC units per episode, and the mean ratio thereof (plasma/RBC units).
Sensitivity analyses
As a first sensitivity analysis, we repeated the patient-level blood product use analysis described above using only those patients in each analysis cohort receiving ≥5 RBC units during the transfusion episode to additionally compare use in patients expe- riencing heavy bleeding. As a second sensitivity analysis, to ensure the chosen hierarchy did not affect our results, we re-ran this analysis using two other hierarchies for group selection (see the Online Supplement Materials and Methods for the hierarchy descrip- tion).
Comparison of transfusion reaction risk for FFP and SD plasma
We compared the risk of non-infectious transfusion reactions between the two plasma types. Infectious transfusion reactions are rarely attributed to plasma transfusion, with the few cases reported involving infection with bacteria present in the water baths used to thaw the plasma units.15
Results
Comparison of blood product use
National plasma use during the study period
Figure 1 shows plasma use in the Netherlands of the
period from 2012 to 2017, with the national switch to SD plasma occurring on January 1, 2014 (the date as of which Sanquin began distributing SD plasma to hospitals as the standard plasma product). As FFP can be stored for up to two years, stocks continued to be distributed and trans- fused in the Netherlands until the end of 2015. Total plas- ma units used decreased by 13% in the course of the 6- year study period. This trend was not reversed by the switch to the smaller SD plasma units.
Patient-level plasma use
Figure 2 shows our data flow. From the six participating hospitals, we collected data on 18,053 transfusion episodes involving plasma transfusion. Together, these episodes involved transfusion of 85,768 plasma units (65,160 FFP; 20,608 SD plasma), 91,318 red cell units, and 26,290 platelet units, and were coded by 891 unique diag- nostic codes. Following exclusion of 192 episodes involv- ing transfusion of both SD plasma and FFP, blood product details for the remaining 17,861 episodes are provided in Table 1. Comparing average plasma units per episode for FFP and SD plasma across the cohorts shows no systemat- ic increase in plasma units transfused with the switch to SD plasma, excepting for the TTP/HUS cohort where the average number of plasma units transfused was higher for SD plasma than for FFP (81 vs. 48 plasma units/episode).
Figure 3 shows the results of our comparison of SD plas- ma and FFP with regard to (a) mean plasma units trans- fused, (b) mean RBC units transfused and (c) mean plas- ma/RBC units ratio for episodes involving transfusion of both RBC and plasma units (13,910 episodes), with
1160
haematologica | 2020; 105(4)
