
Page 290 - Haematologica April 2020
P. 290
J. Russick et al.
Correction of the bleeding phenotype of factor VIII-deficient mice by the endogenously produced factor VIII
We then investigated the effect of a single injection of FVIII-encoding mRNA on the bleeding phenotype of FVIII-deficient mice. FVIII-deficient mice were injected with phosphate-buffered saline (PBS), with FVIII-encoding mRNA or with 1.2 or 3 IU rFVIII (Figure 4). The tip of the mouse tail was clipped after 30 min in the case of rFVIII or after 24 h in the case of PBS or mRNA, which correspond to the activity peak of each individual treatment. Blood loss was followed over 20 min. While the PBS-injected mice lost 274.3±53.4 μL of blood, injection of rFVIII pro- tected the mice from major bleeding with blood loss of 86.0±44.9 μL and 12.2±0.9 μL for 1.2 IU (P<0.05) and 3 IU (P<0.001) rFVIII, respectively. Interestingly, mice injected with FVIII-encoding mRNA lost 45.8±24.6 μL of blood (P<0.001 as compared to PBS-treated mice), showing cor- rection of the bleeding phenotype.
Multiple injections of factor VIII-encoding mRNA trigger an anti-factor VIII immune response
The repeated administration of rFVIII is known to trig- ger the production of inhibitory anti-FVIII IgG in mice after 3-5 injections.27 We thus assessed the effect of multi- ple injections of FVIII-encoding mRNA on the onset of an anti-FVIII immune response. We treated FVIII-deficient mice with 1 μg FVIII-encoding mRNA once a week for 7 weeks. As a control, FVIII-deficient mice were injected once a week with 5 IU rFVIII. First, we measured residual plasma FVIII levels 24 h after rFVIII or mRNA injection
A
(Figure 5A, B). Consistent with the short half-life of FVIII in mice, very low FVIII:Ag and FVIII:C were measured in plasma 24 h following injection of rFVIII during the first 3 weeks of treatment. In the case of mRNA-treated mice, a sharp decrease in both FVIII:Ag and FVIII:C was observed between the first (1.13±0.23 IU/mL and 0.37±0.11 IU/mL, respectively) and second (0.26±0.06 IU/mL and 0.05±0.05 IU/mL, respectively) injections. From the third week of treatment onwards, FVIII:C levels were below the level of detection.
We then investigated the presence of inhibitory anti- FVIII IgG 5 days after each administration of mRNA or rFVIII to the mice (Figure 5C, D). As described previously, the intravenous administration of rFVIII induced a pro- gressive increase in levels of anti-FVIII IgG which reached a plateau after five injections (10168±4501 AU after 7 injections) (Figure 5C). This was mirrored by a gradual increase in levels of FVIII inhibitors, which crossed 10 BU/mL 5 days after the fourth injection to plateau at 111±79 BU/mL (Figure 5D). In the case of FVIII-encoding mRNA, levels of anti-FVIII IgG as high as those obtained after five injections of rFVIII were detected as early as 5 days following the second treatment. The plateau after 7 weeks of treatment (98060±8251 AU) was 10-fold higher in the case of mRNA than in the case of rFVIII. Likewise, while no FVIII inhibitory activity was detected 5 days after the first injection of mRNA, levels of 383±196 BU/mL were generated 5 days after the second injection, and gradually increased to reach a plateau at 2258±669 BU/mL after 7 weeks of treatment. The plateau of FVIII inhibitors was thus 20-fold higher in mice treated with
B
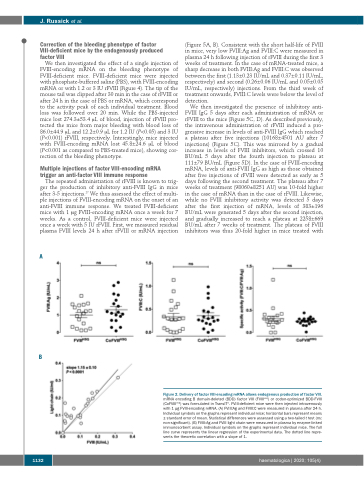
Figure 2. Delivery of factor VIII-encoding mRNA allows endogenous production of factor VIII.
mRNA encoding B domain-deleted (BDD) factor VIII (FVIIIHSQ) or codon-optimized BDD-FVIII (CoFVIIIHSQ) was formulated in TransIT®. FVIII-deficient mice were then injected intravenously with 1 μg FVIII-encoding mRNA. (A) FVIII:Ag and FVIII:C were measured in plasma after 24 h. Individual symbols on the graphs represent individual mice; horizontal bars represent means ± standard error of mean. Statistical differences were assessed using a two-tailed t test (ns: non-significant). (B) FVIII:Ag and FVIII light chain were measured in plasma by enzyme-linked immunosorbent assay. Individual symbols on the graphs represent individual mice. The full line curve represents the linear regression of the experimental data. The dotted line repre- sents the theoretic correlation with a slope of 1.
1132
haematologica | 2020; 105(4)
