
Page 140 - Haematologica April 2020
P. 140
H. Kumar et al.
ABC
DE
FGHI
JK
L
M
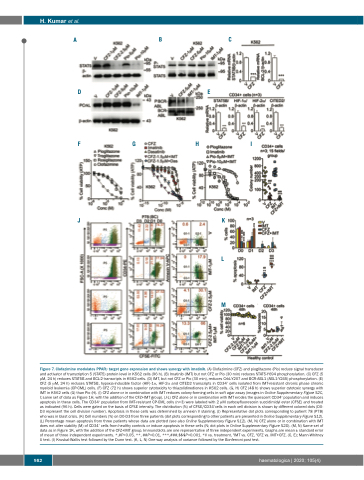
Figure 7. Clofazimine modulates PPARγ target gene expression and shows synergy with imatinib. (A) Clofazimine (CFZ) and pioglitazone (Pio) reduce signal transducer and activator of transcription 5 (STAT5) protein level in K562 cells (96 h). (B) Imatinib (IMT) but not CFZ or Pio (30 min) reduces STAT5-Y694 phosphorylation. (C) CFZ (5 μM, 24 h) reduces STAT5B and BCL-2 transcripts in K562 cells. (D) IMT, but not CFZ or Pio (30 min), reduces CrkL-Y207 and BCR-ABL1 (ABL1-Y245) phosphorylation. (E) CFZ (5 μM, 24 h) reduces STAT5B, hypoxia-inducible factor (HIF)-1α, HIF-2α and CITED2 transcripts in CD34+ cells isolated from IMT-resistant chronic phase chronic myeloid leukemia (CP-CML) cells. (F) CFZ (72 h) shows superior cytotoxicity to thiazolidinediones in K562 cells. (G, H) CFZ (48 h) shows superior cytotoxic synergy with IMT in K562 cells (G) than Pio (H). (I) CFZ alone or in combination with IMT reduces colony-forming cells in soft agar assay (images in Online Supplementary Figure S2C, I; same set of data as Figure 1H, with the addition of the CFZ+IMT group). (J-L) CFZ alone or in combination with IMT erodes the quiescent CD34+ population and induces apoptosis in these cells. The CD34+ population from IMT-resistant CP-CML cells (n=3) were labeled with 2 μM carboxyfluorescein succidimidyl ester (CFSE) and treated as indicated (96 h). Cells were gated on the basis of CFSE intensity. The distribution (%) of CFSE/CD34+cells in each cell division is shown by different colored dots (D0- D3 represent the cell division number). Apoptosis in these cells was determined by annexin V staining. (J) Representative dot plots corresponding to patient 78 (P78) who was in blast crisis. (K) Cell numbers (%) on D0-D3 from three patients (dot plots corresponding to other patients are presented in Online Supplementary Figure S12). (L) Percentage mean apoptosis from three patients whose data are plotted (see also Online Supplementary Figure S12). (M, N) CFZ alone or in combination with IMT does not alter viability (M) of CD34+ cells from healthy controls or induce apoptosis in these cells (N; dot plots in Online Supplementary Figure S2D). (M, N) Same set of data as in Figure 1K, with the addition of the CFZ+IMT group. Immunoblots are one representative of three independent experiments. Graphs are mean ± standard error of mean of three independent experiments. *,#P<0.05, **, ##P<0.01, ***,###,$$$P<0.001. *V vs. treatment, #IMT vs. CFZ, $CFZ vs. IMT+CFZ. (C, E); Mann-Whitney U test. (I) Kruskal-Wallis test followed by the Dunn test. (K, L, N) One-way analysis of variance followed by the Bonferroni post test.
982
haematologica | 2020; 105(4)
