
Page 64 - Haematologica March 2020
P. 64
C. Zhang et al.
Functional analysis of hematopoietic stem cells and hematopoietic progenitor cells
Colony forming cell assay: colony forming cell (CFC) assay was performed in complete MethoCult media (Stem Cell Technologies, Vancouver, Canada), and colony was counted on day 14.
Cobblestone area forming cell (CAFC) assay: cobblestone area forming cell (CAFC) assay was performed as described previously.17 The most primitive HSC showed cobblestones at day 35 of culture, and their frequency was calculated by using L-Calc
Limiting Dilution Analysis Software (Stem Cell Technologies, Vancouver, Canada).
In vivo transplantation assay: in vivo transplantation assay, 3x10⁵ transduced cells (GFP+ cells) plus 2x10⁵ competitor B6.SJL/BoyJ BM cells were injected into B6.SJL/BoyJ mice after 24 hours of transduction, and GFP+ chimerism in peripheral blood (PB) and BM was measured at 16 weeks post transplantation.
Statistical analysis
Data were examined for homogeneity of variances (F-test), then
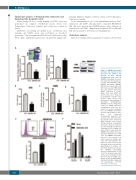
A
BC
D
Figure 4. HMGB2 knockdown increases Lxn expression and decreases the number and function of bone marrow hematopoietic stem cells. (A) HMGB2 knockdown increases Lxn expression in hematopoiet- ic stem and progenitor cells. HMGB2 knockdown (HMGB2 KD) in bone marrow LSK cells (left) increases Lxn mRNA (mid- dle) and protein expression (right) compared to control group (Con). Lxn mRNA and protein levels were measured by quantitative real-time poly- merase chain reaction and western blot. Glyceraldehyde-3- phosphate dehydrogenase (GAPDH) was the endogenous control for mRNA expression normalization. Actin was the control for protein normaliza- tion. (B) HMGB2 knockdown decreases the number of clono-
EF
genic and
hematopoietic progenitor and (C) stem cells. LSK cells trans- duced with control and knock- down lentivirus were sorted, and the numbers of progenitor and stem cells were measured by colony forming cell (CFC) and cobblestone area forming cell assay (CAFC), respectively. (D) HMGB2 knockdown increases apoptosis (Annexin V+) of LSK cells. (E) HMGB2 knockdown increases the proportion of active caspase-3 positive LSK cells. The representative his- togram of active capase-3 flow cytometry profile (top) and the quantification of positive cell proportion (bottom) are shown. (F) HMGB2 knockdown decreases proliferation of LSK cells. The apoptosis and prolif- eration were determined with the same way as in EML cells. Values are the mean±Standard Deviation from three independ- ent experiments. *P<0.05; **P<0.01; ***P<0.001.
functional
578
haematologica | 2020; 105(3)
