
Page 65 - Haematologica March 2020
P. 65
Genetic and epigenetic regulation of latexin transcription
analyzed by Student's t-test or One-way ANOVA using Tukey’s test. P<0.05 was considered statistically significant. All statistical analyses were conducted with Graphpad Prism.7
All animal work and experiments were performed under the guideline of approved Institutional Review Board and Ethics Committee, Biosafety Committee, and Animal Care and Use Committee protocols at the University of Kentucky.
Results
HMGB2 binds to Lxn promoter and suppresses its activity
The transcriptional regulation of the Lxn gene remains largely unknown. We used two criteria to identify the potential promoter in the upstream regulatory region of Lxn. First, we looked for the regions containing SNP because the natural variation of Lxn expression is mainly caused by genetic variants. Secondly, we and others have shown that promoter hypermethylation is involved in the downregulation of Lxn in several types of cancer cells, including leukemia stem cells.19-24 This prompted us to search for regions enriched with CG dinucleotides (CpG island). We thus analyzed the mouse Lxn upstream puta-
tive promoter sequence (http://www.methprimer.com) and identified a CG-enriched region that contains a SNP rs31528793 (Figure 1A). Using the NCBI SNP database (https://www.ncbi.nlm.nih.gov/SNP/snp_ref.cgi?rs=rs3152879 3) search, we confirmed the presence of this polymor- phism. This region spans from the canonical 5’ promoter (-333 nucleotide, nt) to the transcription start site (+1 nt), and extends through the first exon (+27 nt). We next amplified and sequenced this region, confirming the exis- tence of this SNP (data not shown). To determine whether it has promoter activity, we performed in vitro luciferase reporter assay and found that this sequence in Lxn upstream regulatory region had a strong promoter activity (Figure 1B).
We next performed in silico analyses to search for the potential transcription factors in the Lxn promoter region by using the transcription factor prediction program, TRANSFAC (www.cbrc.jp/research/db/TFSEARCH.html). Results from this analysis showed that SNP rs31528793 falls within the consensus binding motif for the transcrip- tion factors, Adr-1 and Ets-1. Our previous microarray data showed that only Ets-1 was expressed in HSC (data not shown). We thus only evaluated the binding of Ets-1 to Lxn promoter with chromatin immunoprecipitation (ChIP)
A
B
CD
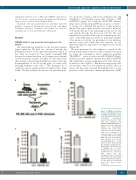
Figure 5. HMGB2 knockdown decreases hematopoietic stem cell (HSC) regenerative capaci- ty. (A) Experimental scheme for competitive repopulation assay. Donor cells were 3x10⁵ LSK cells transduced with HMGB2 shRNA (HMGB2 KD) or control vector (Con), and trans- planted into myeloablated recipient mice along 2x10⁵ competitor cells. Donor derived cells were determined by CD45.2 markers in the periph- eral blood (PB), bone marrow (BM) LSK cells and long-term HSCs (LT-HSC) at 16 weeks post-transplantation. Long- term HSC were determined by the markers lineage-Sca-1+c- kit+flk2–CD34–. (B) Frequencies of HMGB2 KD or control (CD45.2)-derived leukocytes, (C) BM LSK cells, and (D) LT-
HSC. Data are average±Standard Deviation pooled from two independent experiments with five recipients in each group per experiment (n=10 per donor group). **P<0.01.
the
haematologica | 2020; 105(3)
579
