
Page 242 - Haematologica March 2020
P. 242
B. Federmann et al.
Results
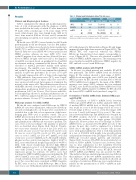
Table 1. Clinical and histological data of the 66 cases.
Diagnosis
cMCL
D1-MCL
nnMCL 8 5:3 76(56-87) 7 1
66 27:39 72 (47-91) 53 13
cMCL: conventional mantle cell lymphoma; D1-MCL: cyclinD1 negative mantle cell lymphoma; nnMCL: non-nodal leukemic mantle cell lymphoma.
2A) with plasmacytic differentiation (Figure 2B) and kappa immunoglobulin light chain restriction (Figure 2D-E). The SOX11 IHC was equivocal whereas the SOX11 RNAscope demonstrated clear signals corresponding to score 1 (Figure 2F-G). This case was classified as nnMCL with low SOX11 mRNA expression. The remaining seven cases classified as nnMCL in BM were SOX11 negative by IHC and had a score 0 with RNAscope.
SOX11 mRNA analysis with RT-qPCR
In 54 cases, for which material was available, RT-qPCR
was performed. The SOX11 mRNA levels are shown in Figure 1F. The analysis showed a wide range of SOX11 mRNA levels among the cases. cMCL cases cyclin D1 and SOX11 positive by IHC showed a median level of 30-fold SOX11 mRNA level compared to the mean of the SOX11 negative cases (range 2-218), whereas the four analyzed D1-MCL cases showed a median SOX11 mRNA level of 12 (range 8-102). nnMCL negative for SOX11 by IHC showed the lowest SOX11 mRNA levels (median 1; range 0-1).
Correlation of SOX11 mRNA levels between RNAscope and RT-qPCR
The correlation of SOX11 mRNA levels between RNAscope and RT-qPCR was further analyzed (Table 2). A median SOX11 mRNA level of 39-fold (range 3-218) was found for score 4, 23-fold (range 6-119) for score 3, 10-fold (range 2-43) for score 2, seven-fold (range 1-68) for score 1, and 1-fold (range 0-1) for score 0. The corre- lation between RNAscope and mRNA levels obtained by RT-qPCR analysis showed a significant association between the median of the single groups (P=0.0002) (Figure 1F). However, there was a broad range of SOX11 mRNA levels, as measured by RT-qPCR in each of the groups. In part, this could be explained by a dilution effect due to the high content of reactive cells in some cases with partial infiltration. This is well demonstrated in a case of D1-MCL with mantle zone growth pattern and partial involvement of the LN (Figure 3A-D). IHC and RNAscope revealed similar patterns and intensities (Figure 3E-F); however, RT-qPCR showed relatively low levels of SOX11 mRNA.16 In most cases; however, there was no clear explanation for the variability between RNAscope and RT-qPCR. In the two BM cases with a lack of signals in the RNAscope assay, RT-qPCR detected SOX11 mRNA and SOX11 was also positive by IHC. This indicates that pre-analytical parameters may differ in their influence on the two mRNA quantification meth- ods. Taken together, although both methods showed an overall good correlation, RNAscope was considered more reliable for the quantification of SOX11 mRNA in indi- vidual cases.
n= Sex female: male
Age Morphology
Clinical and Morphological features
Table 1 summarizes the clinical and morphological fea- tures. A total of 66 patients with the diagnosis of MCL were included in the study of which 27 were female and 39 males with a median age of 72 years (range 47-91 years). Main biopsy sites were lymph nodes (LN) in 31 cases, bone marrow (BM) in 14 cases, and 21 extranodal sites including one spleen, four tonsils and two intestinal biopsies.
Of the 66 cases, 58 (88%) were classified as cMCL with predominantly nodal involvement, but also BM infiltra- tion. Forty-six of these cases showed a classic morphology (46/58, 79%), and 12 cases (12/58, 21%) were classified as blastoid. Fifty-two cases (52/58; 90%) were cyclin D1 and SOX11 positive, whereas six cases (6/58; 10%) were cyclin D1 negative (four classic and two blastoid) but pos- itive for SOX11. In eight of 66 cases (12%), the diagnosis of nnMCL was made based on peripheral blood and BM involvement without or minimal nodal disease. One case classified as nnMCL presented mainly with splenic involvement. The nnMCL cases were SOX11 negative and cyclin D1 positive. In 63 cases immunohistochemical analysis for p53 was performed. In 11 cases (17%) p53 was strongly expressed in >20% of tumor cells suggesting a TP53 mutation. Forty-seven cases (75%) were consid- ered P53 negative (≤20% of tumor cells). Five cases (8%) were equivocal with weak, heterogeneous staining in the majority of the tumor cells. The proliferation rate assessed with MIB1 showed a low proliferation (<10%) in 10 cases, intermediate proliferation (10-29%) in 34 cases, and high proliferation (>30%) in 19 cases. The 12 cases with blas- toid morphology showed a median proliferation rate of 80%. CD5 was analyzed in 65 cases, 54 cases were CD5 positive whereas 11 cases (17%) remained negative.
RNAscope analysis for SOX11 mRNA
Of the 66 cases analyzed with RNAscope for SOX11
mRNA, 63 cases were informative, whereas two BM biop- sies and one lymph node core biopsy were considered not evaluable due to the lack or low expression of the house- keeping gene PPIB used as positive control. The poor mRNA preservation in the two BM most probably is sec- ondary to the decalcification process. The interpretation and quantification of RNAscope was easy to perform. The cases were scored according to the quantity of punctate dots, as described above (Figure 1A-E; Table 2). Twenty- two cases were classified as score 4 (cyc D1+ n=18; cyc D1- n=4), 14 cases as score 3 (cyc D1+ n=13; cyc D1- n=1) 12 cases as score 2 (cyc D1+ n=11; cyc D1-, n=1), eight cases as score 1 (cMCL cyc D1+ n=7; nnMCL n=1) and seven cases as score 0 (nnMCL n=7). All small B-cell lym- phomas used as controls were negative. Eight of 12 (67%) MCL cases with blastoid morphology and 26 of 44 (59%) MCL with classic morphology showed high SOX11 mRNA expression (score 3 or 4). Interestingly, 5/6 (83%) cases with D1-MCL were in the high SOX11 mRNA expression group. In contrast, 15 (24%) cases had low/negative SOX11 mRNA expression including the 8/8 (100%) nnMCL cases and 7/55 (13%) cMCL cases. The overall correlation between IHC and RNAscope was very good. Two cases that were considered as SOX11 negative by IHC were scored as 1 with RNAscope. One of these cases was a case with primary splenic presentation (Figure
median (range) classic
blastoid
52 18:34 6 4:2
72 (49-91) 42 10
63 (47-87) 4 2
756
haematologica | 2020; 105(3)
