
Page 210 - Haematologica March 2020
P. 210
M. Bill et al.
those with a 17-genelow score (P<0.001) (Figure 1B and Online Supplementary Table S4), as previously described by Ng et al.7
Outcome associated with the 17-gene leukemia stem cell score
All patients were assigned to the 17-genelow and 17-genehigh groups based on the median of the initial analysis of the entire cohort of patients. We kept this initial grouping for all additional sub-analyses that could have potentially re- assigned some patients into different 17-gene score
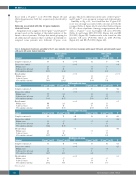
groups. This led to differences in the sizes of the 17-genelow and 17-genehigh score groups in younger and older patients. Similarly to Ng et al.,7 we found that the 17-gene LSC score was strongly associated with outcome in both the younger (Table 2; Figure 2A, B) and older (Table 2; Figure 2C, D) cohorts of patients. Among younger patients, those with a 17-genelow score had higher CR rates (P<0.001) (Table 2) and longer DFS (P<0.001) (Figure 2A) and OS (P<0.001) (Figure 2B). Similar results were found in older patients: CR rates (P=0.004) (Table 2), DFS (P=0.04),
(Figure 2C) and OS (P<0.001) (Figure 2D).
Table 2. Comparison of outcomes according to the 17-gene leukemic stem cell score in younger adults (aged <60 years) and older adults (aged ≥60 years) with acute myeloid leukemia.
Endpoint
Complete remission, %
Disease-free survival Median, years
% disease-free at 3 years 95% confidence interval
Younger patients (n=729)
17-genelow (n=403) 17-genehigh (n=326)
87 63
2.6 0.7
48 26
43-53 20-32
P
<0.001
<0.001
Older patients (n=205)
17-genelow (n=64) 17-genehigh (n=141) P
72 50
0.6 0.5
17 6
8-30 2-13
0.004
0.04
<0.001
Overall survival
Median, years
%aliveat3years 59 27 27 9
95% confidence interval
Endpoint
Complete remission, %
Disease-free survival Median, years
% disease-free at 3 years 95% confidence interval
54-63
17-genelow (n=264)
95
7.7
57
50-63
22-321
16-38
17-genelow (n=20)
90
1.1
39
17-60
5-14
6.5 1.1
<0.001
ELN Favorable-risk group
1.1 0.6
17-genehigh (n=78)
81
1.4
43
31-55
P
<0.001
0.008
17-genehigh (n=23) P 78 0.42
0.6
17
4-37
0.09
0.05
Overall survival
Median, years
%aliveat3years 68 49 50 17
95% confidence interval
Endpoint
Complete remission,%
Disease-free survival Median, years
% disease-free at 3 years 95% confidence interval
17-genelow (n=56)
82
1.3
28
16-42
17-genehigh (n=96)
76
0.7
25
15-35
P
0.42
0.08
17-genelow (n=13)
62
0.7 0
17-genehigh (n=23) P 43 0.49
NR
62-73 37-59
<0.001
ELN Intermediate-risk group
1.1 5-35
2.4
2.4 27-69
0.4
10
1-36
0.92
0.48
Overall survival
Median, years
%aliveat3years 45 28 0 17
95% confidence interval
Endpoint
Complete remission, %
Disease-free survival Median, years
% disease-free at 3 years 95% confidence interval
2.4 31-57
1.4 20-37
0.03
ELN Adverse-risk group
0.9
17-genelow (n=22)
59
0.5 8 0-29
0.7 5-35
17-genelow (n=67)
63
1.1
24
12-37
17-genehigh (n=123)
41
0.6 6 2-15
P
0.004
<0.001
17-genehigh (n=79) P 41 0.15
0.4 0
0.21
0.06
Overall survival
Median, years
%aliveat3years 40 11 18 4 95% confidence interval 29-52 7-18 6-36 1-10
1.6
0.7
0.8
0.5
<0.001
NR: not reached.
724
haematologica | 2020; 105(3)
