
Page 209 - Haematologica March 2020
P. 209
17-gene LSC score: mutations and outcome in AML
Table 1. Comparison of pretreatment clinical and cytogenetic characteristics in 934 patients with acute myeloid leukemia according to low and high 17- gene leukemia stem cell scores.
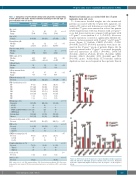
Mutational landscape associated with the 17-gene leukemia stem cell score
To obtain more detailed insights into the mutational patterns associated with the 17-gene LSC signature, we analyzed 81 cancer and leukemia-associated genes.19 We found that 77 genes were mutated in at least one patient (Online Supplementary Table S4). Patients with a 17-genelow score had fewer mutations compared with patients with a 17-genehigh score (median: 2 vs. 3; P<0.001). Moreover, 12 gene mutations occurred at significantly different fre- quencies between patients with 17-genelow and 17-genehigh scores (Figure 1). Biallelic CEBPA (P<0.001), GATA2 (P=0.008), and KIT (P<0.001) mutations were more fre- quent in the 17-genelow group of patients (Figure 1A). In contrast, patients with a 17-genehigh score more frequently harbored mutations in ASXL1 (P=0.001), DNMT3A (P<0.001), KMT2A (P=0.04), RUNX1 (P=0.002), SRSF2 (P=0.02), STAG2 (P=0.009), TET2 (P=0.008) and TP53 (P<0.001) genes. Additionally, FLT3-internal tandem duplications were more frequent in these patients than in
A
B
Figure 1. Differences in the frequencies of gene mutations between patients with low and those with high 17-gene leukemic stem cell scores. Mutations that had a significantly higher frequency in the (A) 17-genelow or (B) 17-genehigh group.
Characteristic
Age, years Median Range
Sex, n (%)
Female
Hemoglobin, g/dL Median
Range
Platelet count, x109/L Median
Range
WBC count, x109/L Median
Range
% Blood blasts Median Range
% Bone marrow blasts Median
Range
EM involvement, n (%)
Present
FAB classification, n (%) M0
M1 M2 M4 M5 M6 M7
ELN group, n (%) Favorable
t(8;21)
inv(16)
NPM1 mut/FLT3-ITD wt or low 211
17-genelow (n=467)
46 17-82
199 (43)
9.2 2.3-25.1
50
7-433
24.1 0.4-303.6
54
0-97
65 0-97
112 (25)
16 (4) 82 (23) 100 (28) 107 (30) 52 (15)
17-genehigh P (n=467)
All patients (n=934)
50 17-84
404 (43)
9.2 2.3-25.1
55
4-592
24.1 0.4-475.0
54
0-99
65 0-97
220 (25)
40 (6) 150 (22) 185 (27) 189 (28) 113 (17)
53 17-84
<0.001
205 (44) 0.74
9.1 0.31 4.2-14.7
63
4-592
<0.001
23.9 0.46 0.6-475
54 0.18
0-99
66 0.91 4-97
108 (24) 0.88 0.18
24 (7) 68 (21) 85 (26) 82 (25) 61 (19)
1(0) 0(0) 1(1) 1(0) 0(0) 1(1)
385 (45) 40
69
101 (24) 0
8
88
5 119 (28) 202 (48)
284 (64) 40
61 123 60
69 (16) 89 (20)
210 (45)
101 (22) 40
61
21 (5) 9 12
19 (4) 4 15
2 (1) 0
<0.001
232 (50) 0.17
<0.001
0.65
<0.001
1.00
<0.001
CEBPA mut Intermediate Adverse
Cytogenetically normal, n (%) Present
CBF, n (%) Present
t(8;21)
inv(16)
KMT2A-rearranged, n (%) Present
t(9;11) t(v;11)
Complex karyotype, n (%) Present
Typical
Atypical
t(6;9), n (%) Present
inv(3), n (%)
Present
65 188 (22) 291 (34)
442 (47)
109 (12) 40
69
46 (5) 19 27
79 (8) 53 26
5 (1) 18 (2)
8 (2) 0
8
25 (5) 10 15
60 (13) 49 11
3 (1) 18 (4)
WBC: white blood cell; EM: extramedullary; FAB: French-American-British; ELN: European LeukemiaNet;mut:mutated;ITD:internaltandemduplication;wt:wild-type; CBF:core-binding factor.
haematologica | 2020; 105(3)
723
