
Page 212 - Haematologica March 2020
P. 212
M. Bill et al.
(Figure 3C), but those with a 17-genelow score had longer OS (P=0.03) (Figure 3D).
Among older patients, the 17-gene score had almost no impact on outcome after classifying the patients according to the ELN recommendations. We found that only older patients in the Favorable-risk group with a 17-genelow score had longer OS than those with a 17-genehigh score (P=0.05) (Online Supplementary Figure S1, Table 2). The 17-gene score showed no prognostic impact in the Adverse- and Intermediate-risk groups.
Discussion
The prognosis of AML patients is still poor, and relapse after achieving a CR is a major clinical challenge.1-4,7 It is thought that leukemia relapse is caused by the persistence of LSC.4-7 A better understanding of LSC and their prog- nostic impact in AML is necessary in order to improve patients’ outcomes. However, the lack of a well-estab- lished phenotype has thus far impeded studies on the clin- ical relevance of LSC frequency. Ng et al.7 recently devel- oped a gene-expression signature, consisting of 17 genes that were found to be deregulated in LSC, to quantify the presence of LSC. They showed that the 17-gene LSC sig-
nature has a prognostic impact. In our study, we not only validated these data in an independent set of 934 adult patients with de novo AML, but also analyzed the prognos- tic impact of the 17-gene LSC score in the context of the current ELN classification. Moreover, we describe a detailed mutational landscape associated with the 17-gene LSC score.
Whereas the 17-gene score was initially derived using microarray data, Ng et al.7 showed in a relatively small set of patients (n=169) that RNA-sequencing data can also be used to derive the score. We validated this finding in a larger set of 934 AML patients with RNA-sequencing data using the same published weights of the score as Ng et al.,7 and demonstrated the robustness of the 17-gene score. We assigned the score to each patient and classified them into a 17-genehigh or 17-genelow LSC group for all further analy- ses, using the median as the cut point.
Clinically, we found that patients with a 17-genelow score were younger and had lower platelet counts at diagnosis. Similar differences in age were also described by Ng et al.7 Next, we compared cytogenetic findings between the groups of patients with 17-genelow and 17-genehigh scores and although we did not find any difference in the inci- dence of cytogenetically normal AML, there was a differ- ent distribution of the specific cytogenetic abnormalities
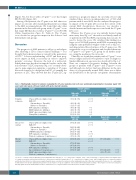
Table 3. Multivariable models for outcome evaluating the 17-gene leukemia stem cell score and known prognosticators in younger (aged <60 years) and older (aged ≥60 years) adults with acute myeloid leukemia.
End point
Complete remission
Disease-free survival
Overall survival
Variable
17-gene LSC score (high vs. low) ELN 2017
(Intermediate vs. Favorable),
(Adverse vs. Favorable)
WT1 (mutated vs. wild-type) ZRSR2 (mutated vs. wild-type) BAALC expression (high vs. low) Hemoglobin (continuous)
17-gene LSC score (high vs. low) ELN 2017
(Intermediate vs. Favorable, Adverse vs. Favorable)
DNMT3A (mutated vs. wild-type)
WT1 (mutated vs. wild-type)
Platelets (continuous, 50-unit increase)
17-gene LSC score (high vs. low) ELN 2017
(Intermediate vs. Favorable),
(Adverse vs. Favorable)
WT1 (mutated vs. wild-type)
Age (continuous, 10-year increase) BAALC expression (high vs. low) Platelets (continuous, 50-unit increase)
Younger patients (n=729)
Older patients (n=205)
Odds ratio P (95% CI)
**
Hazard ratio P (95% CI)
**
Odds ratio (95% CI)
0.36 (0.23-0.56)
0.48 (0.26-0.86) 0.12 (0.07-0.21) 0.47 (0.24-0.92) 0.44 (0.19-0.99) 0.60 (0.39-0.92) 1.16 (1.03-1.30)
Hazard ratio (95% CI)
1.67 (1.31-2.13)
1.84 (1.39-2.42) 2.87 (2.16-3.81) 1.41 (1.09-1.82) 1.94 (1.34-2.80) 0.87 (0.80-0.95)
1.88 (1.53-2.31)
1.77 (1.37-2.29) 2.85 (2.26-3.60) 1.80 (1.33-2.44) 1.17 (1.07-1.27)
P
<0.001 <0.001
0.03 0.05 0.02 0.01
P
<0.001 <0.001
0.008 <0.001 0.003
<0.001 <0.001
<0.001 <0.001
1.70 (1.19-2.41)
1.71 (1.23-2.38) 0.86 (0.77-0.96)
0.003
0.001 0.007
95% CI:95% confidence interval;ELN:European LeukemiaNet.An odds ratio >1 (<1) corresponds to a higher (lower) odds of achieving a complete remission for higher values of continuous variables and the first level listed of a dichotomous variable.A hazard ratio >1 (<1) corresponds to a higher (lower) risk for higher values of continuous variables and the first level listed of a dichotomous variable.Variables were considered for inclusion in the multivariable models if they had a univariable P-value of <0.20. Only markers for which there were at least eight mutated patients in each 17-gene score group (high/low) were included the multivariable modeling.* the 17-gene score does not remain sta- tistically significant in the multivariable model for achievement of a complete remission and disease-free survival in older patients. .
726
haematologica | 2020; 105(3)
