
Page 188 - Haematologica March 2020
P. 188
L. Han et al.
A
BC
D
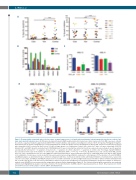
Figure 2. Treatment with cobimetinib and venetoclax causes on-target suppression of cell proliferation and impairs leukemia progenitor function in a subset of pri- mary acute myeloid leukemia cases. (A) Primary acute myeloid leukemia (AML) peripheral blood mononuclear or bone marrow cells from AML cases were cultured in serum-free expansion medium supplemented with BIT 9500 Serum Substitute and cytokines, including stem cell factor (SCF; 100 ng/mL), Flt3 ligand (50 ng/mL), interleukin 3 (IL3; 20 ng/mL), and granulocyte colony-stimulating factor (G-CSF; 20 ng/mL) as well as StemRegenin 1 (SR1; 1 mM). Cells were left untreated or treated with cobimetinib (Cobi) or venetoclax (Van), both at 0.1 mM, as single agents or in combination (Combo). After culture for 5 days, cells were stained with CD45-PE, Annexin-V-APC, and DAPI. Apoptotic leukemia blasts (CD45dimAnnexin-V+) were isolated by flow cytometry. Results are expressed as percentage of specific apoptosis calculated by the formula: 100 × (% apoptosis of treated cells – % apoptosis of control cells)/(100 – % apoptosis of control cells). Percentage of growth inhibition was calculated on the basis of the number of control viable cells (Annexin-V–/DAPI–). **P<0.01; ***P<0.001. (B) Mononuclear cells collected from AML patients (100,000 cells) or healthy donors (50,000 cells; NBM) were plated in methylcellulose, then treated with venetoclax or cobimetinib (both at 0.1 mM) as single agents or in combination. Colonies were scored on day 14. Data are presented as percentage inhibition compared to control groups. (C) The absolute cell counts of AML13 and AML14 samples as determined in (A) are shown in comparison with those of untreated controls (Contr), with median inhibitory concentration (IC50) values indi- cated for each sample. (D) AML13 and AML14 samples were treated with cobimetinib 1.0 mM overnight followed by 10 min with or without (Unstim) stimulation with SCF or G-CSF (100 ng/mL). Cells were fixed, permeabilized, and processed for time-of-lfight mass spectrometry. Spanning-tree progression analysis of density-nor- malized events (SPADE) trees were generated by using markers shown in Online Supplementary Figure S2. The leukemia stem/progenitor populations were manually annotated and highlighted by analysis of all surface markers. The median intensities of pERK and pS6 in gated populations are shown. BCL2 expression in CD34+ and CD34– fractions in both samples is shown. DMSO: dimethylsulfoxide.
702
haematologica | 2020; 105(3)
