
Page 186 - Haematologica March 2020
P. 186
L. Han et al.
microenvironment. The SPADE trees were colored based on expression levels of CD34. In AML13, annotation 4 (6.5% of total viable cells) represented the leukemia stem/progenitor cell population by phenotypically posi- tive expression of CD34, CD123, CD25, CD135, and CD64. Annotation 8 accounted for 53.4% of total viable cells in AML14, and was highly positive for expression of CD34, CD123, CD117, CD135, and CD64 (Online Supplementary Figure S3). In both samples, we observed low basal levels of pERK, which increased following G- CSF stimulation (3.9-fold in AML13 and 5.7-fold increase in AML14). G-CSF-stimulated pERK in both patients’ samples was largely inhibited by cobimetinib despite dif- ferential responses in proliferation assays (Figure 2C, D), indicating that suppression of pERK does not predict sen- sitivity to MEK inhibition and is consistent with previous reports.21 Several studies have shown that suppression of mTORC1 and downstream pathways (especially S6) pre-
dicted sensitivity to MEK inhibition.21,22 We found that pS6 was highly activated by SCF and effectively sup- pressed by cobimetinib in the cobimetinib-sensitive AML sample, whereas the cobimetinib-resistant AML sample did not demonstrate a response to SCF. As in this study, we treated cells overnight and transiently stimulated then for 10 min to look into activation of signal transduction pathways (Figure 2). Due to limited exposure to the inhibitors (2 h), we were unable to detect changes in fre- quencies of AML stem/progenitor cells (Online Supplementary Figure S4).
Transcriptomic and proteomic profiles identify pharmacodynamic markers underlying responses to targeted agents
To identify the pharmacodynamic markers underlying the observed drug responses, we treated the 11 AML cell lines (Table 1) with cobimetinib and venetoclax as single
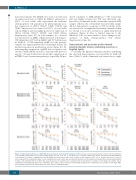
Figure 1. Anti-leukemia efficacy of cobimetinib and venetoclax in acute myeloid leukemia cell lines. Eleven acute myeloid leukemia cell lines were left untreated or treated with cobimetinib or venetoclax as single agents at 0.001, 0.01, 0.1, or 1.0 mM for 72 h. Calcusyn software was used to calculate the median inhibitory concentration (IC50) values. Combinations of the two drugs were then tested on the same cell lines at dose ranges of 0.25, 0.5, 1, 2, and 4 times the IC50 value of each compound. The combination index of each combination in each cell line was calculated on the basis on the luminescent intensity that correlated with number of viable cells determined by the CellTiter-Glo assay. Responses to treatment were categorized into four patterns: (i) sensitive to both drugs; (ii) sensitive only to cobimetinib and showing synergy for the combination; (iii) sensitive only to venetoclax and showing synergy for the combination; (iv) resistant to both drugs. AML: acute myeloid leukemia; Cobi: cobimetinib; Ven: venetoclax; CI: combination index
700
haematologica | 2020; 105(3)
