
Page 187 - Haematologica March 2020
P. 187
Targeting BCL2 and MAPK in AML
agents or in combination for 24 h at doses that were 0.5, 1 or 2 times their IC50 values, followed by RPPA and RNA sequencing analysis. As already described, cells with IC50 values <0.3 mM for cobimetinib or <0.1 mM for venetoclax were categorized as sensitive and those with IC50 values above these cutoffs were considered resistant. For the combination groups, CI values <0.8 were considered syn- ergistic.
Quantification of 90 proteins by RPPA identified several biomarkers that correlated with in vitro drug responses. For example, S6 phosphorylation at Ser235/236 was signifi- cantly reduced in both cobimetinib-sensitive and -resis- tant cell lines compared to untreated cells, with sensitive cells displaying higher basal phosphorylation at Ser235/236. Significant pMEK induction was observed in cobimetinib-resistant cell lines (Figure 3A). Several signal- ing pathways were highly activated under basal condi-
tions in cobimetinib-sensitive cells compared to resistant cells, including pS6 (Ser235/236), pRSK, pERK, p38MAPK and pPTEN (Online Supplementary Figure S5A). Proteins indicating responses to venetoclax treatment were largely limited to the caspase-dependent apoptotic cascade (data not shown). Higher levels of BAX and BCL2 and lower lev- els of BIM and pS6 (Ser240/244) correlated with sensitivi- ty to venetoclax (Online Supplementary Figure S5B). In cell lines in which cobimetinib and venetoclax had a synergis- tic effect, several MEK downstream pathways were signif- icantly downregulated and cleaved poly (ADP-ribose) polymerase (PARP) was detected, indicating induction of apoptosis (Figure 3B). These changes were not identified in cell lines in which a synergistic effect did not occur. The heat maps of the complete RPPA datasets are shown in Online Supplementary Figure S6.
Western blotting was performed to validate the RPPA
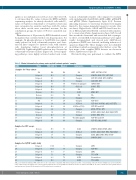
Table 2. Clinical information for primary acute myeloid leukemia patients’ samples.
AML# Status WBC (x109/L) Blasts,% Cytogenetics
Molecular mutations
IKZF1, NOTCH1, BCOR
DNMT3A, IDH2, TP53, FLT3-N841 FLT3-ITD, NPM1, WT1, DNMT3A JAK2, MPL, WT1
CEBPA, ATM
RUNX1, TET2 EVI1
EZH2, MPL NA
TP53
FLT3-D835
FLT3-D835, NOTCH1, ASXL1, KIT, TET2 FLT3-ITD and D835
EGFR, PTPN11, WT1
RUNX1, ASXL1, IDH1, KRAS, NRAS, TET2 RUNX1, TET2, TP53
FLT3-ITD and D835
FLT3-ITD, JAK2, RUNX1
DNMT3A, IDH2m NPM1, ASXL1
RUNX1, ASXL1, IDH1, TET2, NRAS, KRAS ASXL1, EZH2, IDH1, TET2, RUNX1 DNMT3A, IDH1
IDH2 FLT3-ITD IDH2
TP53, ATM No mutations TP53, IDH2
Samples for 5-day culture
1
2 3 4 5 6 7 8 9 10 11 12 13 14 15 16 17 18
Samples for CFC assays
19 20 21 22
NA NA NA NA
Relapsed Relapsed Relapsed Relapsed Relapsed Relapsed De novo Denovo De novo NA Relapsed Relapsed Relapsed Relapsed De novo Relapsed Relapsed
De novo
Relapsed Relapsed Relapsed
34.3 95 21 96 14.9 98 6.5 94 18.3 57 19.9 69 13.5 18 20.6 74 5.9 21 40 24 19 94 45.8 94 6.4 72 5.4 25 12.7 31 4.8 89 4.6 48
85.5 51 2.4 50 1.7 82 5.8 32
104.4 3 163.5 98 10.9 10 5.1 88 80.1 72 13.1 63
Complex Complex Complex 46,XY,t(9;11)(p22;q23) 47,XY,+21
NA
46,XX
NA Complex Complex 47,XY,+8 45,XY,der(17;18) Complex 47,XY,+8 Complex 46,t(X;X)(q22;q26) Complex
46,XX 47,XX,+8 Complex Complex
Complex Complex Complex Complex 46,XX 46,XX
Samples for CyTOF (only) study
23 Relapsed
24 Relapsed
25 Relapsed
26 Relapsed
27 Relapsed
28 Relapsed
AML: acute myeloid leukemia; WBC: white blood cell count; NA: not available; ITD: internal duplication; CFC: colony-forming cells; CyTOF: time-of-flight mass spectrometry. For 5-day culture assays, all samples were collected from peripheral blood, except AML #15, which was from bone marrow, and AML #1, #5, and #9, which were from patient-derived xenograft mouse spleens.All the samples for CFC assays were bone marrow.
haematologica | 2020; 105(3)
701
