
Page 268 - 2020_02-Haematologica-web
P. 268
S. Staessens et al.
between thrombi. Whereas some thrombi were platelet- dominant, others were RBC-dominant (Figure 2). Overall, the amount of RBC-rich material ranged from 0.4% to 89.0% (mean 43.9±20.4%) , which corresponds to a range from 11% to 99.6% (mean 56.1±20.4%) for platelet-rich material. Typically, both regions are interspersed through each other within a thrombus. However, some thrombi typically consisted of an RBC-rich core that was surround- ed by platelet-rich material (Online Supplementary Figure S3).
The relative amount of RBC-rich or platelet-rich materi- al most likely affects the way stroke thrombi react to phar- macological or endovascular intervention. To better under- stand the specific characteristics of both regions, we per- formed a more detailed microscopic analysis.
Red blood cell-rich areas are composed of packed red blood cells within a meshwork of fibrin
Higher magnifications of RBC-rich areas stained by H&E and MSB showed the presence of RBC that were packed together with little or no nucleated cells (Figure 3A and B). To further characterize these RBC-rich zones, immunofluorescent stainings were performed for fibrin(ogen), platelets and vWF. RBC were identified based on their inherent autofluorescence. Interestingly, fluores- cent co-stainings showed densely-packed RBC within a meshwork of thin fibrin strands (Figure 3C and D). vWF (sometimes together with platelets) was only rarely detected and did not form a main constituent of these RBC-rich areas (Online Supplementary Figure S4). Taken together, the RBC-rich portion of ischemic stroke thrombi
A
C
B
D
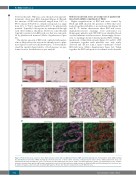
Figure 4. Platelet-rich areas consist of dense fibrin structures lined with von Willebrand Factor (vWF) and filled with platelets. Hematoxylin & Eosin (H&E) staining (A) and Martius Scarlet Blue (MSB) staining (B) show the presence of dense fibrin structures, indicated by the black arrows, within platelet-rich areas. (C) Immunohistochemical staining was used to specifically visualize fibrin(ogen) (left panel, purple) and vWF (right panel, purple). (D) Immunofluorescence analysis allowed to visualize fibrin (green), vWF (purple), and platelets (red). Dense fibrin structures (white arrows) are lined with vWF and filled with platelets. Scale bars are: (A and B, left panels, and C) 100 μm; (A and B, right panels) 25 μm; (D) 10 μm. P: platelet-rich area; R: RBC-rich area.
502
haematologica | 2020; 105(2)
