
Page 208 - 2020_02-Haematologica-web
P. 208
B. Maurer et al.
and activation of STAT5A and STAT5B (score 3 or 4) than non-reactive lymph node samples (score 1 Figure 6A, B), in line with nuclear staining indicative of enhanced STAT5-mediated transcriptional activity. Comparable results were obtained when samples of AITL and various CTCL cases were analyzed (Online Supplementary Figure S6A-C), in line with previous reports.48-51 pYSTAT5 stain- ing on PTCL and AITL cases confirmed that nuclear STAT5A/B staining corresponds to elevated pYSTAT5 levels (Online Supplementary Figure S6D). Analysis of STAT5A and STAT5B mRNA expression levels in 18
PTCL, NOS samples compared to non-diseased human lymph nodes (n=4) showed six-fold and two-fold upreg- ulation of STAT5A and STAT5B expression, respectively (Figure 6C, Online Supplementary Figure S6E). Similar results were obtained when we compared seven AITL cases to control tissue (Online Supplementary Figure S6F). Enhanced STAT5A expression was strongly correlated with elevated STAT5B levels (Online Supplementary Figure S6E-F). To increase the numbers of patients and disease entities, tissue microarrays were quantified for STAT5A and STAT5B expression – with highly positive STAT5A
AB
C
D
E
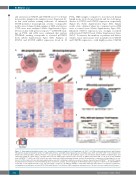
Figure 5. Transcriptional profiling reveals close correlation to human peripheral T-cell lymphoma. (A) CD8+ T-cell RNA-sequencing (performed with Illumina HiSeq2500) analysis showing the number of significantly (left) up- and (right) down-regulated genes in wildtype (wt), cS5Alo and cS5Ahi CD8+ T cells obtained from lymph nodes (n=5/genotype; adjusted P-values <0.1, log2 fold change >1 and <-1). (B) Summary of gene set enrichment analysis (GSEA) of hallmark gene sets enriched in cS5Ahi vs. cS5Alo CD8+ T cells [false discovery rate (FDR) ≤0.25, adjusted P-value ≤0.05)]. (C) RNA isolated from CD8+ T cells of wt (n=10), hSTAT5B (n=4), hSTAT5BN642H, cS5Alo and cS5Ahi (all n=5) mice were subjected to RNA-sequencing. Heatmap of genes deregulated in a comparison of all genotypes to wt con- trols (n=1,055) clustered for up- and down-regulated genes specific to individual conditions, as well as for genes shared between hSTAT5BN642H and cS5Ahi. Scaled, rlog transformed normalized counts from DESeq2 were used for the analysis. (D) Venn diagram of differentially expressed genes in cS5Ahi vs. wt and hSTAT5BN642H vs. wt CD8+ T cells (adjusted P-values <0.1, log2 fold change >1 and <-1). (E) GSEA of STAT5BN642H and cS5Ahi expression data shows a correlation to peripheral T- cell lymphoma, not otherwise specified (PTCL, NOS) with cytotoxic T-cell features. NES: normalized enrichment score. The gene set was compiled from literature.6,7
442
haematologica | 2020; 105(2)
