
Page 205 - 2020_02-Haematologica-web
P. 205
High STAT5A activity promotes CD8+ T-cell neoplasia
of diseased cS5Ahi transgenic mice into non-irradiated immunocompetent Ly5.1+/CD45.1+ recipient mice (Figure 4A). Recipients of cS5Ahi CD8+ T cells showed an increase in white blood cell count starting from 8 weeks after trans- plantation due to an expansion of the Ly5.2+ cS5Ahi-CD8+ T cells in contrast to wt-derived CD8+ T cells (Figure 4B, Online Supplementary Figure S4A). Recipients of cS5Ahi-
A
B
C
CD8+ T cells had splenomegaly (Online Supplementary Figure S4B) and high levels of donor-derived cS5Ahi-CD8+ T cells in organs (Figure 4C, D, Online Supplementary Figure S4C, D). We conclude that cS5Ahi-CD8+ T cells can expand and rapidly infiltrate multiple organs in wt recipients. This indicates that high pYSTAT5 in CD8+ T cells induces a transplantable disease.
D
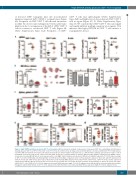
Figure 2. High STAT5A activation promotes CD8+ T-cell neoplasia. (A) Flow cytometric analysis of splenocytes of diseased cS5Ahi mice and wildtype (wt) littermates showing absolute CD8+ T-cell (P=0.0001), CD4+ T-cell (P=0.0002), B-cell (P≤0.0001, all unpaired t-test with the Welch correction), CD11b+Gr1hi (P=0.0014) and nat- ural killer (NK)-cell numbers (P=0.0237, both unpaired t-test) (B) Left: tumor weight of subcutaneous (s.c.) MC-38 tumors 18 days after injection of 1x10⁶ cells in both flanks of 10-week old wt (n=11), cS5Alo (n=9) and cS5Ahi (n=10) mice (one-way analysis of variance with the Tukey multiple comparison test). Middle: macro- scopic view of isolated MC-38 tumors, scale bar represents 1 cm. Right: tumor incidence per injection of MC-38 cells (logistic regression, P=0.031) and percentage of CD8+ T-cell tumor infiltrating cells (Kruskal-Wallis test with the Dunn multiple comparison test). (C) Flow cytometric analysis of CD2, CD3 and CD5 expression on CD8+ wt (n=10) and cS5Ahi (n=11) splenocytes. Mean fluorescent intensity (MFI) unpaired t-test (CD2 P=0.85, CD3 P=0.91, CD5 P=0.0002), relative expression unpaired t-test with the Welch correction (CD2 P=0.0001, CD3 P=0.0044, CD5 P=0.0021). (D) Flow cytometric characterization of splenic wt (n=13) and cS5Ahi (n≥31) CD8+ T cells: CD25 (left, P<0.0001, unpaired t-test) and CD44 expression (right, P<0.0001, unpaired t-test with the Welch correction) with representative histograms and (E) CD44+CD62L+ (left, P<0.0001, unpaired t-test with the Welch correction) and CD44+CD62L- expression (right, P=0.0492, unpaired t-test).
haematologica | 2020; 105(2)
439
