
Page 185 - 2020_02-Haematologica-web
P. 185
Allogeneic transplantation for -5/5q- AML
presence of CK, MK and abn(17p), based on their prognos- tic impact shown in univariate and multivariate analysis and their capability to distinguish biologically and clinical- ly meaningful cytogenetic categories. Our study contains 154 monosomy 5 and 347 deletion 5q. We decided to
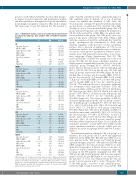
Table 3. Multivariate analysis using a Cox proportional hazard model by cytogenetic subgroups. Only variables with a P<0.05 in univariate analysis.
P HR 95%CI
RI
study -5 and 5q- together in order to analyze the impact of MK separately from -5. Indeed, all of our -5 patients except one fulfilled the definition of MK. Thus, the “5q sole group” contained 47 patients with 5q abnormali- ties but absence of additional -7/7q-, abn(17p), CK or MK. Notably, no case of -5 was included in this group. The “CK group” included 90 patients who fulfilled the definition of CK but without abn(17p) or MK. Only one patient with - 5 was included in this group. The “MK group” was com- prised of the group of patients with -5/5q- within a MK with the exception of abn(17p), and finally, the “abn(17p) group” encompassed the combination of -5/5q- with abn(17p) regardless of the presence of other cytogenetic features. Due to the lack of significance of -7/7q- in our multivariate analysis, this abnormality was not taken into account in our prognostic classification. Patients’ charac- teristics were well balanced between those four cytoge- netic subgroups (Online Supplementary Table S3). The 2-year probability of NRM was similar across the four groups (P=0.86), but the 2-year cumulative incidence of relapse increased significantly from the “5q sole” up to the “abn(17p)” group, reaching 45.3% (95%CI: 29.9-59.5), 52.7% (95%CI: 40.9-63.1), 61.5% (95%CI: 53.5-68.6) and 65.7% (95%CI: 58.1-72.3) in the 5q sole, CK, MK and abn(17p) groups, respectively (P=0.006) (Figure 2A and B). Median time to relapse was 6.2 months (IQR: 3.5-16.3), for the “5q sole group”, 4.7 months (IQR: 2.3-8) for the “CK group”, 4.5 months (IQR: 2.3-9.1) for the “MK group” and 3.9 months (IQR: 2.2-8.7) for the “abn(17p) group” (P=0.12). This different RI across cytogenetic subgroups also determined other important outcomes. Thus, the 2-year probability of LFS was 39.4% (95%CI: 24.8-54) for the “5q sole group”, 25.4% (95%CI: 15.6-35.3) for the “CK group”, 19.8% (95%CI: 13.5-26.1) for the “MK group” and 12.6% (95%CI: 7.5-17.7) for the “abn(17p) group” (P<0.001) (Figure 2C). The 2-year probability of OS also decreased significantly from the “5q sole group” down to the “abn(17p) group”, reaching 59.7% (95% CI: 45.2-74.2, 31% [95% CI: 20.5-41.6], 6.5% [95% CI: 19.4-33.5] and 16.3% [95% CI: 10.5-22] in each group, respectively (P<0.001) (Figure 2D). The 2-year probability of GRFS fol- lowed the same trend, with 26.5% [95% CI: 13-39.9] for the “5q sole group”, 17% [95% CI: 8.5-25.4] for the “CK group”, 14.2% [95% CI: 8.7-19.7] for the “MK group” and only 6.6% [95% CI: 2.8-10.4] for the “abn(17p) group” (P<0.001) (Online Supplementary Figure S2). In contrast, the cumulative incidence of grade II-IV acute GvHD and the 2-year cumulative incidence of chronic GvHD were not different across the four groups (P=0.33 and P=0.8, respec- tively).
In multivariate analysis, taking the “5q sole group” as a reference, the “CK group” did not show any significant difference in RI, NRM, LFS, OS, LFS and GRFS. In con- trast, patients in the “MK group” and “abn(17p) group” experienced higher incidence of RI and lower LFS, OS and GRFS compared to the “5q sole group” (Table 3). To min- imize the strong impact of disease status on outcome, we decided to run the univariate by cytogenetic subgroups focusing on the 338 patients transplanted in CR1. The “MK group” and “abn(17p) group” had the same negative impact on RI, LFS and OS (Figure 3). As detailed above, the presence of -7/7q- was excluded from the “5q sole group”, but was present in 21% of the “CK group”, 51% of the “MK group”, and 40% of the “abn(17p) group”. Given the high overlap between the -7/7q and the “MK
Age (per 10 year) 0.65
MUD vs. MSD 0.44
Active disease vs. CR <0.0001
KPS ≥ 80% 0.06
RIC vs. MAC 0.11
5q sole (reference) 1
CK 0.67 MK 0.02 Abn(17p) 0.002
NRM
1.12 0.66-1.91 1.74 1.09-2.8 2.11 1.32-3.37
1.03 0.91-1.16 0.91 0.71-1.16 1.73 1.32-2.27 0.64 0.40.1.01 1.25 0.95-1.63
Age (per 10 year) 0.0007
MUD vs.MSD 0.001
Active disease vs.CR 0.002
KPS ≥ 80% 0.22
RIC vs. MAC 0.23
5q sole (reference) 1
1.48 1.18-1.85 2.07 1.32-3.25 2.00 1.3-3.08 0.61 0.27-1.35 0.76 0.48-1.19
CK 0.96 MK 0.63 Abn(17p) 0.22
LFS
1.02 0.46-2.26 1.19 0.58-2.47 1.55 0.76-3.14
Age (per 10 year) 0.03
MUD vs.MSD 0.35
Active disease vs.CR <0.0001
KPS ≥ 80% 0.03
RIC vs.MAC 0.44
5q sole (reference) 1
CK 0.7 MK 0.03 Abn(17p) 0.001
OS
1.09 0.70-1.69 1.57 1.05-2.33 1.93 1.30-2.84
Age (per 10 year) 0.006
MUD vs.MSD 0.24
Active disease vs. CR <0.0001
KPS ≥ 80% 0.04
RIC vs.MAC 0.46
5q sole (reference) 1
1.12 1.01-1.25 1.11 0.90-1.36 1.8 1.43-2.27 0.64 0.43-0.96 1.1 0.87-1.38
1.16 1.04-1.3 1.14 0.92-1.41 1.88 1.49-2.38 0.66 0.44-0.98 1.09 0.86-1.38
CK 0.25 MK 0.006 Abn(17p) 0.0002
GRFS
1.31 0.83-2.08 1.80 1.19-2.72 2.19 1.45-3.30
Age (per 10 year) 0.08
MUD vs.MSD 0.18
Active disease vs.CR <0.0001
KPS ≥ 80% 0.06
RIC vs. MAC 0.77
5q sole (reference) 1
CK 0.14 MK 0.008 Abn(17p) 0.0003
1.37 0.90-2.09 1.69 1.15-2.48 2.03 1.39-2.98
1.14 1.04-1.26 1.15 0.94-1.41 1.64 1.31-2.04 0.68 0.46-1.01 1.03 0.82-1.3
HR: hazard ratio; CI: confidence interval; RI: relapse incidence; MUD: matched unrelat- ed donor ; MSD: matched sibling donor; CR: complete remission; KPS: Karnofsky’s per- formance status; RIC: reduced-intensity conditioning; MAC: myeloablative condition- ing; abn(17p): 17p abnormalities; CK: complex karyotype; MK: monosomal karyotype; NRM: non-relapse mortality; LFS: leukemia-free survival; OS: overall survival; GRFS: graft-versus-host and relapse-free survival.
haematologica | 2020; 105(2)
419
