
Page 184 - 2020_02-Haematologica-web
P. 184
X. Poiré et al.
ciated with the risk of developing acute or chronic GvHD. The factors associated with GRFS were the same as those described for LFS and OS (see above and Table 2). The main cause of death was disease-related (61%), followed by infections (16%) and GvHD (13%).
The multivariate analysis performed in the entire cohort confirmed the strong impact of disease status at the time of transplantation on RI, NRM, LFS and OS (Online Supplementary Table S1). Increasing age was associated with higher NRM, which translated into significantly worse LFS and OS without impacting RI. The use of MUD was associated with higher NRM with no effect on OS. A good performance status at SCT was associated with less relapse and improved LFS and OS. Conditioning intensity did not impact any SCT outcome parameters in multivari-
ate analysis. While active disease at SCT and MUD were associated with higher incidence of grade II-IV GvHD, no factor was associated with chronic GvHD in multivariate analysis (Online Supplementary Table S2). In our stepwise selection of cytogenetic variables (as described in the methods), -7/7q- lost any significance on outcomes and we kept only CK, MK and abn(17p) in our final multivari- ate model. There was a significant correlation between Abn(17p) and decreased LFS, OS and GRFS.
Outcomes by cytogenetic subgroups
In order to elucidate the impact of additional cytogenet- ic abnormalities on outcomes of patients with AML and -5/5q-, we defined four different subgroups within our entire cohort in a hierarchical manner according to the
AB
CD
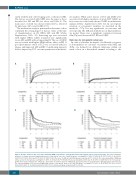
Figure 2. Relapse incidence (RI), non-relapse mortality (NRM), leukemia-free survival (LFS) and overall survival (OS) by cytogenetic groups. The 2-year cumulative incidence of relapse increased significantly from the “none group” up to the “abn(17p) group”, reaching 45.3% [95% CI: 29.9-59.5], 52.7% [95% CI: 40.9-63.1], 61.5% [95% CI: 53.5-68.6] and 65.7% [95% CI: 58.1-72.3] in the none, CK, MK and abn(17p) groups, respectively (P=0.006) (A). The 2-year probability of NRM was similar across the four groups, reaching 19.9% [95% CI: 16.4-23.7] (P=0.86) (B). The 2-year probability of LFS was 39.4% [95% CI: 24.8-54] for the “none group”, 25.4% [95% CI: 15.6-35.3] for the “CK group”, 19.8% [95% CI: 13.5-26.1] for the “MK group” and 12.6% [95% CI: 7.5-17.7] for the “abn(17p) group” (P<0.001) (C). The 2-year probability of OS decreased significantly from the “none group” down to the “abn(17p) group”, reaching 59.7% [95% CI: 45.2-74.2], 31% [95% CI: 20.5- 41.6], 26.5% [95% CI: 19.4-33.5] and 16.3% [95% CI: 10.5-22] in each group respectively (P<0.001) (D).
418
haematologica | 2020; 105(2)
