
Page 74 - 2019_12-Haematologica-web
P. 74
T. Raskovalova et al.
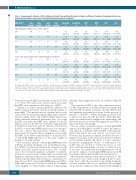
Table 3. Accuracy point estimates (95% confidence interval) for predefined thresholds of robust coefficient of variation for peripheral blood neu- trophil myeloperoxidase expression in discriminating myelodysplastic syndromes.
MPO RCV, % True False
False True Sensitivity, Specificity,
N
positive negative positive negative % %
PPV, NPV, % %
52 100 (41–63) (29–100)
LR+* LR−*
1.07 0.14 (0.98–1.17) (0.01–2.69)
Myelodysplastic syndrome cases versus controls† 28.0 44041
29.0 43138
30.0 43130
31.0 41320
32.0 40411
3 100 6.8 (92–100) (1.4–19)
6 98 14 53 86 1.13 0.17
(88–100) (5.2–27) (42–64) (42–100) (1.00–1.28) (0.02–1.33)
14983259931.430.07 (88–100) (19–48) (47–70) (68–100) (1.17–1.76) (0.01–0.52)
24935567892.050.13
(81–99) (39–70) (54–79) (71–98) (1.47–2.86) (0.04–0.38)
33917578893.640.12 (78–98) (60–87) (65–89) (75–97) (2.16–6.12) (0.05–0.31)
Consecutive patients with suspected myelodysplastic syndromes‡
28.0 15045810015251001.150.20 (78–100) (6.8–28) (15–38) (63–100) (1.00–1.33) (0.01–3.26)
29.0 150381510028281001.360.11
(78–100) (17–42) (17–42) (78–100) (1.12–1.64) (0.01–1.72)
30.0 150332010038311001.560.08 (78–100) (25–52) (19–46) (83–100) (1.25–1.96) (0.01–1.29)
31.0 150272610049361001.900.06
(78–100) (35–63) (22–52) (87–100) (1.51–2.56) (0.01–0.99) 32.0 1322033876239942.300.21
(60–98) (48–75) (23–58) (81–99) (1.54–3.42) (0.06–0.79)
N: number; LR+: likelihood ratio of a positive result; LR−: likelihood ratio of a negative result; MPO: myeloperoxidase; NPV: negative predictive value; PPV: positive predictive value; RCV: robust coefficient of variation. *0.5 was added to all cell frequencies before calculation of likelihood ratios for robust coefficient of variation thresholds with num- bers of false-negative cases equal to zero. † The analytical sample consisted of 88 subjects, including 44 myelodysplastic syndrome cases and 44 controls. ‡ The analytical sample consisted of 68 consecutive patients,including 15 and 53 patients with and without myelodysplastic syndrome,respectively.
between low-grade MDS and cytopenic controls [3.7 (0.9) vs. 3.7 (0.7)]. The authors also did not report area under the ROC curve estimates for the diagnosis of MDS.9
Cherian et al. derived and prospectively validated a PB MDS scoring system based on flow cytometry analysis of neutrophils.7,8 This prediction score combined data on side scatter and four neutrophil immunophenotypic variables (CD11a, CD66, CD10, and CD116 antigen expression). Using published individual participant data,7 we found that the area under the ROC curve estimate for the PB MDS score was 0.87 (95%CI: 0.70-0.96) compared with 0.94 (95%CI: 0.86-0.97) and 0.87 (95%CI: 0.76-0.94) for the RCV of neutrophil MPO expression in our retrospec- tive case control and prospective validation studies, respectively. Yet a head-to-head comparison of area under the ROC curves between the PB MDS score and the RCV of neutrophil MPO expression on the same sample of patients is currently lacking.
Flow cytometric analysis of neutrophil MPO expression in PB has potential advantages over cytochemical evalua- tion. While cytochemical evaluation shows moderate reli- ability and yields normal results in up to 75% of MDS cases,11 flow cytometric analysis is amenable to standard- ization across laboratories.32 Additionally, our study found high intra- and inter-assay precision, satisfactory inter-lab- oratory reproducibility, and robustness to instrument set- tings. Because RCV of neutrophil MPO expression in PB is stable with storage at 4°C for up to 24-96 h, blood samples can be shipped to a central facility, without compromising
reliability. Interestingly, the results are available within 90 min.
The suspicion of MDS is one of the commonest reasons for BM examination in elderly patients presenting with persistent PB cytopenia of unclear etiology.33 BM biopsy and aspiration are painful procedures for the majority of patients,34,35 with 20% of them reporting a moderate level of pain seven days after the procedure.36 Although infre- quent, procedure-related complications (hemorrhage and infection) may be associated with significant morbidity or may even be life-threatening.37
The use of flow cytometric analysis of neutrophil MPO expression in PB might be suitable to reduce the unneces- sary exposure of patients without MDS to BM aspirate- related discomfort and risk and its associated costs. However, this hypothesis remains speculative because a diagnostic accuracy study cannot provide direct evidence on the clinical benefits and safety of such a strategy.17 Prospective management studies or randomized con- trolled trials are needed to evaluate processes of care, short- and long-term patient outcomes, as well as the use of resources associated with the implementation of flow cytometric analysis of neutrophil MPO expression in PB for patients with suspected MDS in routine practice.17
Our study has limitations that deserve mention. 1) The retrospective case control study design is prone to spec- trum bias,10 with the potential of providing diagnostic accuracy estimates that are too optimistic. Reassuringly, our prospective validation study replicated the findings in
2388
haematologica | 2019; 104(12)
