
Page 72 - 2019_12-Haematologica-web
P. 72
T. Raskovalova et al.
lence of MDS and ICUS was 22% and 12%, respectively. The median RCV values for MPO expression in PB were 38.1% (range: 31.3-99.2), 37.2% (range: 32.5-50.2), and 30.6% (range: 26.1-34.1), for patients with MDS, ICUS, and no MDS, respectively (P<0.001) (Online Supplementary Table S3). The odds ratios of MDS associated with a 1% increase in RCV were 1.28 (95%CI: 1.10-1.50) in univari- able analysis and 1.34 (95%CI: 1.08-1.21) in multivariable analysis adjusting for age, C-reactive protein, and creati- nine concentrations. The median RCV values for MPO expression of circulating neutrophils were 37.5% (IQR: 32.7-45.8) and 65.9% for 14 low- and one high-risk MDS cases, compared with 31.0% (IQR: 28.9-32.5) for 53 con- secutive patients with unconfirmed suspected MDS (Online Supplementary Table S1).
The area under the ROC curve (0.87, 95%CI: 0.76-0.94) for the RCV was higher than that for the median and mean in discriminating patients with versus without MDS (Figure 3). A RCV value <30.0% excluded MDS for 29% (20 of 68) of consecutive patients referred for suspected disease, with both sensitivity and negative predictive value point estimates of 100% (Table 3).
Precision and reproducibility assessment
Coefficient of variation point estimates for intra-assay precision ranged from 0.4% to 0.5% for five healthy indi- viduals and from 0.0% to 0.9% for five MDS cases (Online Supplementary Table S5). The coefficient of variation point estimate for inter-assay precision was 3.6% in five inde- pendent analytical runs at the same laboratory (Online Supplementary Table S6).
Compared with baseline values, the mean changes in RCV were -1.8 percentage points (95%CI: -2.4 to -1.3, rel- ative change, -7%) at 24 h and 0.6 percentage points (95%CI: -0.4 to 1.7, relative change, 2%) at 72 h for 10 samples stored at 4°C (Online Supplementary Table S7). After post-processing (stained, lysed, fixed), no significant change was observed in mean RCV (-0.1 percentage points, 95%CI: -0.6 to 0.4, relative change, -0.4%) between baseline and 6-h measurements for five samples stored at 4°C (Online Supplementary Table S8).
The mean coefficient of variation point estimates across instrument setup procedures were 0.3% (range: 0-0.5) and 0.8% (range: 0.3-1.2) in one laboratory and 2.5% (range: 1.0-3.0) and 1.7% (range: 0.8-3.0) in the other laboratory
2386
haematologica | 2019; 104(12)
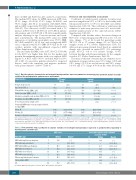
Table 1. Baseline patients’ characteristics and neutrophil myeloperoxidase expression parameters measured by flow cytometric analysis in periph- eral blood for myelodysplastic syndrome cases and controls.
Characteristics
MDS cases* (N=44)
Controls† P (N=44)
Female gender, n (%)
19
(43)
19 (43) -‡ 73.4 (11.0) 0.94
Age, mean (SD), y
73.2 10.7 142 1.9 87 19
(10.0) (9.0–12.7) (75–190) (1.3–3.0) (67–110) (63)
Hemoglobin, median (IQR), g/dL
13.8 (13.0–14.9) 246 (206–283) 3.8 (3.1–4.6)
<0.001 <0.001 <.001
Platelet, median (IQR), ×109/L
Absolute neutrophil count, median (IQR), ×109/L
Creatinine, median (IQR), μmol/L
73 (64–82) 0.03
C-reactive protein ≥ 3 mg/L, n (%)
5 (13)
<0.001
Neutrophil MPO expression in peripheral blood, median (IQR)
Mean, FI
6083
(3905–9904) (3777–9482) (37.8–46.9)
6515 (4230–9749) 0.95 6355 (4110–9520) 0.71
Median, FI
5527
Robust coefficient of variation, %
40.2
30.9 (29.7–31.9)
<0.001
WHO MDS type
(Range)
N Median
(Range)
MDS with single lineage dysplasia
1 38.6
(-) (33.3–49.5) (28.3–66.3) (30.3–53.5) (30.6–73.2) (39.4–99.3) (32.3–66.1) (-) (28.3–99.3)
1 36.4
(-) (31.3–31.5) (38.1–50.2) (32.3–61.0) (-) (-) (35.1–45.8) (-) (31.3–99.2)
MDS with ring sideroblasts
MDS with multilineage dysplasia MDS with excess blast 1
MDS with excess blast 2
MDS with isolated del(5q) Chronic myelomonocytic leukemia Unclassifiable MDS
2 - 9 42.1 7 39.2 17 38.6 3 40.2 5 45.3 0 -
2 - 3 40.5 3 32.7 1 65.9 1 99.2 3 42.5 1 36.9 15 38.1
All
44 40.2
N: number; MDS: myelodysplastic syndrome; WHO: World Health Organization.
MDS cases N Median
Consecutive patients with confirmed suspicion of MDS
percentiles); MDS: myelodysplastic syndrome; MPO: myeloperoxidase; SD: standard deviation. *Values
N/n: number; FI: fluorescence intensity; IQR: interquartile range (25–75th
were missing for hemoglobin concentration (n=1),platelet count (n=1),absolute neutrophil count (n=2),C-reactive protein (n=14),and creatinine (n=9) concentrations among myelodysplastic syndrome cases. †Values were missing for C-reactive protein (n=5) and creatinine (n=6) concentrations among controls. ‡Myelodysplastic syndrome cases and controls were matched for gender (See Methods).
Table 2. Flow cytometric robust coefficient of variation estimates for neutrophil myeloperoxidase expression in peripheral blood according to myelodysplastic syndrome type.
