
Page 174 - 2019_12-Haematologica-web
P. 174
S.N. Chaurasia et al.
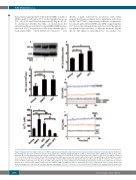
Fura-2 AM-stained platelets with either DMOG (1 mM) or DFO (1 mM) for 15 min at 37°C evoked significant rises in [Ca2+]i (by 2.21- and 1.64-fold, respectively) (Figure 4D, E). To understand whether the entry of calcium from the external medium contributed to the DMOG/DFO-mediat- ed rise in [Ca2+]i, we pretreated cells with ethylene glycol- bis(β-aminoethyl ether)-N,N,N’,N’-tetraacetic acid
AB
(EGTA, 1 mM) followed by incubation with either reagent. EGTA pretreatment led to significant reductions (by 69.7 and 77.66%, respectively) in the rise of intracellu- lar calcium induced by DMOG and DFO, suggesting that Ca2+ crosses the cell membrane and enters into the platelet cytoplasm in the presence of hypoxia-mimetics (Figure 4D, E). The influx of extracellular Ca2+ was further con-
C
E
D
F
Figure 4. Hypoxia-mimetics induced increases in HIF-2a expression, shedding of extracellular vesicles and a rise in intracellular Ca2+ in human platelets. (A) Western blot showing the expression of HIF-2a in platelets treated with either dimethyloxalylglycine (DMOG, 1 mM) or deferoxamine (DFO, 1 mM) for 15 min at 37°C under normoxia. (B) Corresponding densitometric analysis of HIF-2a normalized to β-actin (n=4). (C) Platelets were exposed to DMOG (1 mM) or DFO (1 mM) for 15 min at 37°C in normoxic conditions. Platelet-derived extracellular vesicles (PEV) were isolated and analyzed with a Nanoparticle Tracking Analyzer (n=3). (D) Fura-2-loaded platelets were pretreated for 5 min with either calcium (1 mM) or EGTA (1 mM) and then incubated with DMOG (1 mM) or DFO (1 mM) for 15 min at 37°C under nor- moxic conditions. Intracellular Ca2+ was measured. RP, resting platelets. (E) Corresponding bar chart showing the intracellular calcium levels (n=4). (F) Fura-2-loaded platelets were pretreated with DMOG or DFO before the addition of MnCl2 (2 mM) after 260 sec and fluorescence was recorded (n=3). Data are represented as the mean ± standard error of mean of at least three different experiments. *P<0.05; **P<0.01; ****P<0.00005; #P<0.05; ##P<0.01, analyzed by the Student t test.
2488
haematologica | 2019; 104(12)
