
Page 173 - 2019_12-Haematologica-web
P. 173
Platelet HIF-2α induces a prothrombotic state
platelets incubated for 2 h under normoxic conditions, which was comparable to the shedding from cells exposed to hypoxia for a similar duration (Figure 3C). The release of EV from platelets evoked by shorter exposure (15 min) to DMOG (1 mM) or DFO (1 mM) was almost similar to
that evoked by the longer incubation period (Figure 4C). A rise in intracellular Ca2+, [Ca2+]i, is a hallmark of platelet activation34 and plays a critical role in the release of EV.35 We next examined the effect of hypoxia-mimetics on calcium homeostasis in human platelets. Incubation of
ABC
DE
G
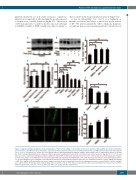
Figure 3. Hypoxia and hypoxia-mimetics induced translation of PAI-1 and shedding of extracellular vesicles from platelets. Hypoxia-mimetics promoted thrombo- genesis in mice. (A, B) Western blots showing the expression of PAI-1 in platelets pretreated or not with puromycin (Puro, 10 mM) and then exposed to either hypoxia (1% O2, 5% CO2, and 94% N2) for 30 min (A) or the hypoxia-mimetics dimethyloxalylglycine (DMOG, 1 mM) or deferoxamine (DFO, 1 mM) under normoxia for 30 min (B). (D, E) Corresponding densitometric analyses of PAI-1 expression normalized to β-actin (n≥4). (C) Platelets were either exposed to hypoxia (1% O2, 5% CO2, and 94% N2) for 2 h or pretreated with hypoxia-mimetics (DMOG, 1 mM; or DFO, 1 mM) under normoxia for 15 min at 37°C followed by 2 h at room temperature. Platelet- derived extracellular vesicles (PEV) were isolated and analyzed with a Nanoparticle Tracking Analyzer (n=6). (F-H) Thrombogenesis in mice treated with hypoxia-mimet- ics. (F, H) Bar diagrams representing time to first thrombus formation (F) and thrombus growth rate (H) in mice pre-administered vehicle (control), DMOG (400 mg/kg) or DFO (200 mg/kg). (G) Representative time-lapse images of mesenteric arteriolar thrombosis in mice pre-administered vehicle (control), DMOG, or DFO; the images were captured 10 or 15 min after ferric chloride injury of the mesenteric vessels (n=3). Data are represented as the mean ± standard error of mean of at least three different experiments. *P<0.05; **P<0.01; #P<0.05; ##P<0.01, analyzed by the Student t test.
H
F
haematologica | 2019; 104(12)
2487
