
Page 162 - 2019_12-Haematologica-web
P. 162
L. Mazzera et al.
of PIM1/2 protein levels (Figure 12C), that significantly (P<0.005; n=10) influenced the responsiveness of the cells to pan-AKI, with similar response rates between newly diagnosed (n=3) and relapsed (n=7) patients (Figure 12D and Online Supplementary Figures S2A and S3), thereby indicating that these kinases may significantly impact on the susceptibility of MM cells to pan-AKI exposure.
Discussion
The critical role of NIK in regulating non-canonical and canonical NF-κB pathways in MM,4-6 together with the fact that NIK and Aurora kinases can converge on com- mon targets,24-26 prompted us to hypothesize that NIK might interfere with and reduce or bypass the NF-κB
inhibitory effects exerted by pan-AKI on MM cells. In sup- port of this hypothesis, we found that pan-AKI induce NIK protein stabilization and that this depended on the downregulation of the TRAF2 protein, one of the critical NF-κB negative regulators that, together with TRAF3, form a molecular bridge that couples NIK to the NIK K48- ubiquitin ligase cIAP1/2.6,7 We also found that TRAF2 reduction was sufficient to elevate NIK protein levels in MM cells harboring alterations in the TRAF3-binding domain of NIK or in TRAF3 itself, thus confirming that TRAF2 can regulate NIK stabilization independent of TRAF3.4,45
Although experimental overexpression of NIK led to a marked activation of both NF-κB and STAT3 pathways, its induction by pan-AKI resulted in the activation of only the STAT3 pathway, thereby suggesting that Aurora kinases
A
B
CD
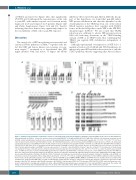
Figure 9. Pharmacological inhibition of Abl kinase enhances cytotoxicity induced by Aurora inhibition. (A) Multiple myeloma (MM) cell lines were incubated with ima- tinib and nilotinib at 2 μM for 3 hours (h), and were then treated with MK-0457 (0.4 μM) and PHA-680632 (1 μM). After 48 h the cell death was measured by sub- G1 DNA content and Annexin-V method. Values represent means±Standard Deviation (SD) of four independent experiments. (°P<0.05, *P<0.005, **P<0.001 vs. either treatment alone; Dunnett and Tukey-Kramer tests). (B) CD138-purified plasma cells from nine patients with MM seeded in presence of HS-5 cells and periph- eral blood mononuclear cells (PBMC) from five healthy volunteers were preincubated for 3 h with imatinib or nilotinib at 2 μM and then with MK-0457 (0.4 μM) or PHA-680632 (1 μM). After 24 h cell death was measured by annexin-V staining or sub-G1 DNA content. Because of heterogeneous levels of basal cell death, the data of all nine primary samples and PBMC tested are expressed as % of specific cell death with the formula % Specific cell death = 100 x (induced cell death−basal cell death)/(100−basal cell death) and are shown in box plot format (median line in box delimited by 25th and 75th (*P<0.005 vs. either treatment alone; Dunnett test). (C) MM cell lines were transfected with siRNA against Aurora A and Aurora B (AURK A+B) or unrelated non-specific control siRNA (Cont) and after 48 h MM cell lines were subjected to western blot analysis to monitor the expression of Aurora A and Aurora B and Actin. Twenty-four hours after siRNA transfection, MM cell lines were treated with imatinib or nilotinib at 2 μM. After 48 h of treatment cell death was measured by flow cytometry analysis of Annexin-V staining or sub-G1 DNA con- tent. Values represent means±SD of three independent experiments. (°P<0.05, *P<0.005 vs. imatinib and nilotinib of Control siRNA conditions; Dunnett and Tukey- Kramer tests). (D) CD138-purified plasma cells from three patients with MM (samples MM#5, MM#6, MM#13) and PBMC from two healthy volunteers (samples V#1 and V#2) were incubated with MK-0457 (0.4 μM) or PHA-680632 (1 μM) and after 24 h were subjected to western blot analysis to monitor the expression of NIK, phospho-c-Abl (Thr735), phospho-c-Abl (Tyr245), phospho-c-Abl (Tyr412), c-Abl, phospho-STAT3 (Ser727), phospho-STAT3 (Tyr705), STAT3 and Actin. Bands were sub- jected to densitometric scanning and normalized to Actin. c-Abl and STAT3 phosphorylations were normalized to total c-Abl and STAT3, respectively. The relative fold change of protein levels was normalized with respect to the level of the untreated control, which was taken as 1, and is shown under each lane.
2476
haematologica | 2019; 104(12)
