
Page 139 - 2019_12-Haematologica-web
P. 139
Single-agent CHK1 inhibition in CLL
AB
CD
E
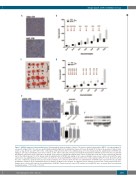
Figure 6. MU380 suppresses tumor growth in vivo. (A) Immunohistochemical analysis of tumors. The tumors consisted dominantly of MEC-1 cells expressing the B- cell specific antigen CD20. The cells were proliferating showing the high Ki-67 positivity. Bars represent 50 μm. (B) Growth of the tumors in experiment I. Mean tumor volume at day (D)+29 was 1897 mm3 in the control group (CTR) and 1072 mm3 in the inhibitor group (P<0.001). Arrows mark the administration of MU380 (20 mg/kg) or 20% aqueous Kolliphor alone (mock control). (C) The tumors extracted at D+29 post transplant in Experiment I. MU380: tumors from mice treated with the inhibitor; CTR: tumors from control mice. (D) Growth of the tumors in experiment II. Mean tumor volume at D+28 was 1771 mm3 in the control group and 695 mm3 in the inhibitor group (P<0.001). Arrows mark the administration of MU380 (20 mg/kg) or 20% aqueous Kolliphor alone (mock control). (E, top left) The repli- cation stress was significantly increased in tumor cells from mice treated with MU380 compared to those from control animals (CTR) (P<0.001). (E, bottom left) In the same comparison, apoptosis increase was modest. Samples were collected 24 h after the last administration of MU380. Bars represent 50 μm. (E, right) Quantitative evaluation of the immunohistochemical analysis. (F) Western blot analysis of replication stress markers in tumors from control and treated mice. Samples were collected 24 h after the last administration of MU380. Tumors from two control (CTR) and two treated (MU380) mice are shown. Error bars represent standard deviation. ***P<0.001; **P<0.01.
F
haematologica | 2019; 104(12)
2453
