
Page 76 - 2019_11 Resto del Mondo-web
P. 76
L. Liang al.
A
B
CD
EF
G
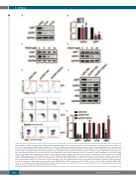
Figure 2. USP7 regulates erythroid differentiation by affecting GATA1 protein levels. (A) Representative western blot analysis of erythroblasts transfected with con- trol or USP7 short hairpin (sh)RNA on day 9. GAPDH was used as a loading control. (B) Bar graph presentation of USP7 and GATA1 mRNA levels as determined by real-time quantitative polymerase chain reaction analysis of erythroblasts transfected with the negative control shRNA or USP7 shRNA #1 or #2, which were har- vested on day 9. (C) Representative western blot analysis of the erythroblasts after treatment with indicated doses of P5091 on day 9. GAPDH was used as the load- ing control. (D) Representative western blot analysis of the erythroblasts after treatment with different doses of P22077 on day 9. GAPDH was used as the loading control. (E) The upper panel shows the representative profiles of flow cytometry analysis of GPA expression on day 9 in erythroblasts transfected with control shRNA and NC (HMD empty vector), USP7 shRNA and NC, or USP7 shRNA and GATA1 (GATA1-HMD). The middle panel shows the representative profiles of flow cytometry analysis of Band3/α4-integrin expression of the GPA-positive cells in the same groups on days 11 and 13. The bottom panel shows the representative profiles of flow cytometry-based detection of enucleation by syto16 staining on day 13. Quantification from three independent experiments is indicated. (F) Representative western blot analysis of erythroblasts transfected with control shRNA and NC (HMD empty vector), USP7 shRNA and NC, or USP7 shRNA and GATA1 (GATA1-HMD) on day 9. (G) Bar diagram presenting the quantitative analysis of protein expression data from (F). The plot was generated from three independent experiments and shows the means ± standard deviations (**P<0.01, *P<0.05).
2182
haematologica | 2019; 104(11)
