
Page 62 - 2019_11 Resto del Mondo-web
P. 62
L. Shao et al.
ferences were observed between WT and Notch1+/- litter- mates in hematopoietic progenitors and lineages in the BM and thymus (Online Supplementary Figure S5D-H). These findings show that a single allele of the Notch1 receptor
was sufficient for recovery of the hematopoietic system and development of the T-cell lineage following myelosup- pression. Thus, the phenotype observed in Notch+/ΔTAD mice was unique and depended on the function of the TAD.
ABC
DEFG
HIJ
KL
M
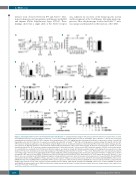
Figure 2. Transcriptional defect in T-cell development induced by Notch1+/ΔTAD. (A) Experimental design of 5-fluorouracil (5-FU) treatment of recipient mice reconsti- tuted with hematopoietic stem cells (HSC) from Notch1+/∆TAD mice. Three hundred and fifty HSC from 5-week old wildtype (WT) or Notch1+/∆TAD donors were sorted and transplanted into irradiated CD45.1/2+ WT recipients. After transplantation, 5-FU (150 mg/kg) was injected intraperioneally into recipient mice on days 1 and 14. (B) Kaplan-Meier plot after 5-FU injection of recipients reconstituted by either WT or Notch1+/∆TAD HSC. Mice (n=6/group) were monitored daily until day 28 after the first 5-FU injection. Statistical significance was determined using the Mantel-Cox test. (C) Absolute numbers of donor-derived HSC in the bone marrow 14 days after the 5-FU injection. (D) Absolute numbers of donor-derived common lymphoid progenitors (CLP) in bone marrow at day 14 after the 5-FU injection are shown as mean± standard deviation (SD). (E, F) Cytometric analysis and quantification of donor-derived early T-cell precursors (ETP) and double-negative 3 (DN3) cells from the thymus of reconstituted mice at day 14 after 5-FU injection. Absolute numbers are shown as mean± SD. (G) Representative images of the thymus from recipient mice at day 14 after 5-FU injection. (H, I) Expression of the indicated genes in the DN3 population from WT or Notch1+/∆TAD mice (n=3). Thymic DN3 cells collected by flow-activated cell sorting at day 9 after injection of phosphate-buffered saline (PBS) (H) or 5-FU (I). Fold changes in the relative gene expression in Notch1+/∆TAD DN3 cells are shown normalized to WT expression and GAPDH. (J) Expression of Notch1-ICN and Notch1-ICN∆TAD in CD25+ thymocytes (n=3). CD25+ thymocytes from WT, Notch1+/∆TAD and Notch+/- mice were isolated by anti-CD25 dynabead magnetic sorting and whole cells were lysed to measure protein expression of cleaved Notch1 ICN (val1744) by western blot. ICN is 100 kDa, ICN∆TAD is 75 kDa, and a non-specific band of ~65kDa is seen in all three lanes. (K) U2OS cells transfected with pMIGR1 control vector, pMIGR1-Notch1 ICN and pMIGR1-Notch1 ICN∆TAD. At 48 h, protein expression of Notch1 ICN and Notch1 ICN∆TAD was measured by western blot. (L) Experimental design of the luciferase assay. U2OS cells were transfected with reporters pRL-TK, pGL3-CSL4X, and with either pMIGR1 control vector or ICN or ICN∆TAD or both ICN and ICN∆TAD at indicated ratios (n=3). (M) Firefly luciferase activity was measured relative to renilla luciferase activity. Values are shown relative to the empty vector. *P<0.05, **P<0.01, ***P<0.001.
2168
haematologica | 2019; 104(11)
