
Page 61 - 2019_11 Resto del Mondo-web
P. 61
Loss of Notch1 TAD interferes with niche recovery
blood cell counts as well as hemoglobin levels (Online Supplementary Figure S4G). 5-FU treatment continued to affect the recovery of the T-cell lineage populations origi- nating from Notch1+/ΔTAD donors (Figure 2D-F), which led to a 50% decrease in thymic mass (Figure 2G). Our findings showed that loss of a single Notch1 TAD allele markedly impaired T-cell development in the reconstituted WT recipients, but had no other adverse effects on hematopoiesis.
Notch1 haploinsufficiency has no effect on hematopoietic recovery
To test whether Notch1 haploinsufficiency can account for pancytopenia, weight loss and morbidity after chemotherapy, we treated Notch1+/- mice with 5-FU (Online Supplementary Figure S5A). Notch1+/- mice exhibited no sig- nificant difference in body score index compared to WT mice and had no discernable hematopoietic phenotype (Online Supplementary Figure S5B, C). Furthermore, no dif-
AB
CD
EF
GHI
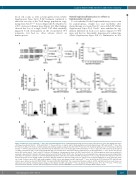
Figure 1. Limited recovery of Notch1+/∆TAD mice after chemotherapeutic stress. (A) Experimental design of 5-fluorouracil (5-FU) injection. 5-FU (150 mg/kg) was inject- ed intraperioneally into Notch1+/+ (WT) and Notch1+/∆TAD 5-week old mice on days 1 and 14. (B) Kaplan-Meier plot indicating survival of WT and Notch1+/∆TAD mice after 5-FU injection. Mice (n=5-9) were monitored daily until terminal analysis at day 28 after the first 5-FU injection. The statistical significance (P=0.01) between WT and Notch1+/∆TAD 5-FU-treated littermates was determined by the Mantel-Cox test. (C) Body weight of WT and Notch1+/∆TAD mice 9 days after 5-FU injection. (D) Red blood cell (RBC) and platelet (PLT) counts and hemoglobin (Hb) concentration were determined from peripheral blood of WT and Notch1+/∆TAD mice (n=5-9 mice/group) before (D0) and at days 4, 7 and 9 after 5-FU injection. (E) Numbers of hematopoietic stem cells (HSC) and Lin-Sca1+c-kit+ (LSK) progenitors in the bone marrow were analyzed 9 days after 5-FU injection. HSC were defined as Lin-c-kit+Sca1+CD150+CD48- cells. The numbers of each population are expressed as mean± standard devi- ation (SD). (F) Cytometric analysis of common lymphoid progenitors (CLP) in bone marrow from WT and Notch1+/∆TAD mice at day 14 after 5-FU injection. CLP were defined as Lin-c-kitlowSca1lowCD135+CD127+ (left panel). Absolute numbers of CLP from each mouse are expressed as mean± SD (right panel). (G, H) Cytometric analy- sis of early T-cell precursors (ETP) and double-negative 3 (DN3) cells in the thymus from WT and Notch1+/∆TAD mice at day 14 after 5-FU injection. ETP and DN3 pop- ulations were defined as Lin-c-kit+CD25+CD144+ (G) and Lin-CD4-CD8-CD44-CD25+ (H), respectively. Absolute numbers of ETP and DN3 cells from each mouse are expressed as mean± SD. (I) Representative images of the thymus from WT and Notch1+/∆TAD mice at day 14 after 5-FU injection. *P<0.05, **P<0.01, ***P<0.001. ICN: intracellular domains of Notch; TAD: transcriptional activation domain; RAM: RBP-J-associated molecule domain; ANK: ankyrin repeats.
haematologica | 2019; 104(11)
2167
