
Page 155 - 2019_11 Resto del Mondo-web
P. 155
Identifying Richter’s after BCRi Therapy
Table 2. Characteristics of patients with biopsy-confirmed Richter’s transformation at screening.
Patients 12345678
Summary
74 (54–84)
7 (88)
6.6 (3.2 – 16) 3 (2 – 12)
Age,† years
Sex‡
Time from diagnosis,† years Prior therapies,† n del(17p)/TP53 mutation‡ Screening PET-CT SUVmax† Largest node at baseline,† cm β2 microglobulin,† mg/L
ALC, x109/L†
54 81
Female Male 6.7 6.6 3 8 Yes No 12 19 3 8 n/A 3.7
1.5 30.9
63 76
Male Male 3.1 3.3 2 3 Yes Yes 12 11 3 7 1.6 5.9 21.4 1.3
84 81
Male Male 6.2 14.2 3 12
Yes No 22 2 N/A N/A
3.5 N/A
30.4 1.1
72 68
Male Male 16 N/A 9 3
Yes Yes 5(63) 0.5 N/A* 12 (0.5 – 22)
N/A 4 4(3–8) N/A N/A 3.6 (1.6 – 5.9)
3.5 160 12.4 (1.1 – 160)
del(17p): chromosome 17p deletion; PET-CT: positron emission tomography-computed tomography; SUVmax: maximum standardized uptake value of 18-F-fluorodeoxyglucose; ALC: absolute lymphocyte count; N/A: data not available. †Summary column describes the median (range) across the eight patients. ‡Summary column describes the number (n) (%) across the eight patients.*Patient had an abnormal CT SCAN prior to screening for study,which led to a biopsy to confirm Richter’s transformation.PET-CT was not per- formed but the patient was excluded based on biopsy findings.
AB
C
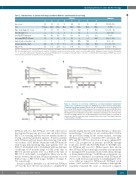
Figure 1. Outcomes on venetoclax stratified by screening maximum standardized uptake value of 18-F-fluorodeoxyglucose (SUVmax) by positron emission tomography- computed tomography imaging. Shown are the investigator-assessed (A) progression- free survival (PFS), and (B) overall survival (OS) on venetoclax as assessed by the inves- tigator for patients with screening SUVmax <10 (n=114) and SUVmax ≥10 (n=13). (C) Investigator-assessed duration of response is shown for responders on venetoclax strat- ified by screening SUVmax <10 (n=74) and SUVmax ≥10 (n=8). Number of patients at risk for the event at each time point is shown below each curve. Tick marks represent censored data. n: number.
SUVmax ≥10, two had SUVmax <10 with other factors that required biopsy per protocol, and one did not have PET-CT at screening and thus was not included in the fol- lowing sensitivity/specificity analysis. Fourteen patients with SUVmax ≥10 had biopsy demonstrating CLL with- out evidence of RT. Of the 14 patients with SUVmax ≥10 with biopsy demonstrating CLL, nine patients were off BCRi [7 off ibrutinib and 2 off idelalisib with median time off therapy of 0.8 months (range: 0.1-18)] at the time of PET-CT, and five patients were on a BCRi at the time of PET-CT (3 on ibrutinib, 2 on idelalisib). There was no dif- ference between the median SUVmax in patients on or off BCRi at time of PET-CT [5 (range: 0.5-28) vs. 5 (range: 0- 73), respectively].
In a prior analysis, Michallet et al. showed that SUVmax >10 was the most effective cutoff value to identify RT in
patients largely treated with chemotherapy or chemoim- munotherapy.10 Given this, we also evaluated this cutoff in the post-BCRi setting. In the current analysis, screening SUVmax ≥10 had 71% sensitivity, 50% specificity, 26% PPV, and 88% NPV for detection of biopsy-confirmed RT versus CLL progression in patients post-BCRi therapy [odds ratio: 2.5 (0.4-15); P=0.318)] (Table 3). The ROC area for SUVmax ≥10 was 61%. Other reports have shown that SUVmax ≥5 provided high sensitivity and specificity to distinguish RT in patients treated with chemotherapy or chemoimmunotherapy.3,9 In BCRi-exposed patients, we observed no difference in sensitivity with SUVmax ≥5 (71%), with decreased specificity for identifying RT (4%) versus what we report for SUVmax ≥10. SUVmax cutoff points of ≥11 and ≥12 were also evaluated, although the sensitivity remained the same or decreased compared
haematologica | 2019; 104(11)
2261
