
Page 116 - 2019_11 Resto del Mondo-web
P. 116
C. Di Genua et al.
Experimental approaches investigating collaboration between Aml1-ETO and activated Ras have mainly used retroviral expression of oncogenes, showing that such mutations collaborate to cause an acute leukemia.40,41 However, retroviral transduction can lead to expression at non-physiological levels as well as ectopic expression within the cellular hierarchy.4 This method, therefore, may not accurately address the effect of the mutant pro- teins on HSC function or the ability of mutations expressed at relevant levels to induce transformation of progenitor cells. Consistent with this, in our model sys- tem, knock-in of Am1-ETO and K-RasG12D was insuffi-
AB
DE
FG
cient to cause transformation of myeloid progenitors. Other approaches using conditional knock-in mutations or gene knock-out to study the collaboration between pre-leukemic mutations, such as the bi-allelic Cebpa mutations, Tet2 and Dnmt3a knock-out, in combination with the signaling mutation Flt3-ITD have resulted in leukemic transformation.4-6 However, Flt3 is not expressed at detectable levels in repopulating mouse HSC.42 Therefore, such modeling cannot measure the intrinsic effect of a signaling mutation on pre-leukemic HSC, whereas cell-extrinsic effects of FLT3-ITD would be likely to play a role.24 Indeed, in order to study pre-
C
HIJK
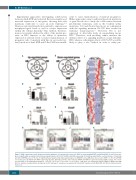
Figure 5. RNA sequencing reveals distinct molecular signatures of hematopoietic stem cells (HSC) co-expressing Aml1-ETO and K-RasG12D. (A and B) Venn-dia- gram of significantly up-regulated (A) and down-regulated genes (B) in HSC identified by RNA sequencing. (C) Heatmap depicting the read per kilobase of transcript per million (RPKM) values of the top 30 significantly up-regulated and down-regulated genes in AKM HSC versus AM [false discovery rate (FDR) < 0.05]. (D-G) RPKM of selected genes identified from RNA sequencing, Gja1 (D), Gzmb (E), Etv4 (F), and Ccnd1 (G). RPKM and FDR were generated using edgeR package. The results are presented as mean±Standard Deviation. *P<0.05; **P<0.01; ***P<0.001; ****P<0.0001. (H-K) Gene set enrichment analysis (GSEA) of AKM versus AM HSC for oxidative phosphorylation (H), hypoxia (I), p53 pathway (J), and genes up-regulated in human HSC transduced with AML1-ETO (K). NES: normalized enrich- ment score.
2222
haematologica | 2019; 104(11)
