
Page 115 - 2019_11 Resto del Mondo-web
P. 115
K-Ras mutation depletes pre-leukemic HSC
sion. The loss of disease-propagating HSC also likely under- lies the amelioration of the K-RasG12D-induced myelopro- liferative phenotype when the mutations were combined.
Signaling mutations are thought to have a negative cell- intrinsic impact on HSC as enhanced proliferation tends to reduce competitiveness and self-renewal potential. Previous studies have shown N-RasG12D increases cell division and reduces the self-renewal in a subset of HSC. However, this negative impact is counteracted as N- RasG12D also increases the self-renewal potential and reduces division in another subset of HSC. This bimodal
effect allows NRasG12D-expressing HSC to outcompete WT HSC, in contrast to our observations with K- RasG12D.23 Recently, signaling mutations have also been shown to have a negative cell-extrinsic impact on HSC by disrupting HSC-supporting BM stromal cells and increas- ing inflammation-associated gene expression.24 Sabnis et al. have shown that K-RasG12D expression cell-intrinsi- cally drives HSC into cycle and reduces HSC frequency; however, long-term fitness of K-RasG12D-expressing HSC was not analyzed due to lethality caused by K- RasG12D-induced myeloproliferation.20
ABC
DE
FGH
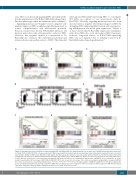
Figure 4. Hematopoietic stem cells (HSC) co-expressing Aml1-ETO and K-RasG12D are characterized by loss of quiescence and HSC-associated gene expression.
(A-C) Bulk CD45.2 LSKCD150+Flt3- cells were subjected to RNA sequencing (5-6 biological replicates per genotype in two independent experiments). Gene set enrich- ment analysis (GSEA) of AKM versus AM HSC for E2F targets (A), Myc targets (B), and genes associated with G2M checkpoint (C). (D) Representative FACS plots showing cell cycle analysis of CD45.2 LSKCD150+Flt3- phenotypic HSC from the bone marrow (BM) of recipients of CON (n=6 recipient mice in 2 independent exper- iments), AM (n=9 recipient mice in 3 independent experiments), KM (n=4 recipient mice in 2 independent experiments), and AKM FL (n=6 recipient mice in 3 inde- pendent experiments). (E) Percentage of BM CD45.2 LSKCD150+Flt3- cells at each cell cycle stage. The results were analyzed using multiple comparison ANOVA. The results are presented as mean±Standard Deviation. *P<0.05; **P<0.01; ***P<0.001. (F-H) GSEA analysis of AKM versus AM HSC for HSC gene signature (F), genes up-regulated in granulocyte-monocyte progenitor (GMP) that lack Gata1 expression compared to HSC (G), and genes down-regulated in GMP that lack Gata1 expression compared to HSC (H). NES: normalized enrichment score; FDR: false discovery rate.
haematologica | 2019; 104(11)
2221
