
Page 173 - 2019_10 resto del Mondo_web
P. 173
HDAC + MEK or BCL-2 inhibition in multiple myeloma
cell line U266 were all sensitive to MEK + HDAC inhibi- tion and had high baseline expression of p-MCL-1 (T163) (Figures 1A and 5A). On the other hand, the RAS/RAF wild-type cell lines KMS18 and OPM2 were resistant to MEK + HDAC inhibition, but sensitive to BCL-2 + HDAC inhibition. These cell lines also had high expression of p- BCL-2 (S70) (Figures 4B and 5A). However, the correlation between sensitivity to either drug combination and RAS/RAF mutational status was not perfect: DOX40 and KMS28 both have mutated RAS, but were sensitive to BCL-2 + HDAC inhibition rather than to MEK + HDAC inhibition. Finally, KMS11, which was resistant to both combinations, has wild-type RAS/RAF. Thus, we conclude that p-BCL-2 (S70), p-MCL-1 (T163) and RAS/RAF muta- tional status could all be useful biomarkers to predict for sensitivity to either the MEK + HDAC or BCL-2 + HDAC inhibitor combinations.
HDAC inhibition alters the phosphorylation of MCL-1
Given that HDAC inhibition dissociated BIM from MCL-1, we investigated whether LBH589 altered the expression of any BH3-only proteins that could theoreti- cally bind to MCL-1 to displace BIM. However, at the doses at which we observed synergy, LBH589 did not appreciably alter the expression of any of the BH3-only proteins, including NOXA, PUMA, BAD, BID, BIK, BMF or HRK (data not shown). Since we found that baseline post-translational modifications on several of the anti- apoptotic BCL-2 family members correlated with sensitiv- ity to either drug combination, we studied whether LBH589 altered any post-translational modifications on MCL-1 or BCL-XL that could explain the BIM dissociation.
Interestingly, LBH589 down regulated p-MCL-1 (S64) in a time- and dose-dependent manner (Figure 5B). In addi- tion, AZD6244 increased p-MCL-1 (S64), which may explain in part why MCL-1 becomes “primed” with BIM after AZD6244 treatment (Figure 5C). When the drugs were combined, LBH589 still decreased p-MCL-1 (S64) when compared to AZD6244 alone (Figure 5C). Taken together, it seems that LBH589 might facilitate apoptosis by decreasing the phosphorylation of MCL-1 at the S64 residue, making it less “sticky” to BIM, especially after it becomes primed with BIM in the context of MEK inhibitor treatment.29
p-MCL-1 (S64) is known to be driven by JNK,29 and CDK1/2.29,30 However, we were unable to replicate syner- gy when we used JNK or CDK inhibitors in combination with AZD6244 or ABT-199 (data not shown). Relatively less is known about the role of post-translational modifica- tions on BCL-XL, but similar to BCL-2 and MCL-1, phos- phorylation has been documented to modulate the anti- apoptotic role of BCL-XL.20 However, LBH589 did not appreciably alter p-BCL-XL (S62) levels (data not shown).
HDAC6 inhibition does not enhance apoptosis induced by MEK inhibition
Next, we wanted to identify which HDAC(s) must be inhibited for the observed synergy to occur with MEK or BCL-2 inhibitors. First, we examined the role of HDAC6 given the relevance of inhibiting the aggresome pathway in MM and early clinical results obtained using HDAC6 inhibition in the relapsed/refractory setting.15,31 Treating cells with AZD6244 in combination with the HDAC6- specific inhibitor tubacin did not lead to synergistic cell
AB
C
D
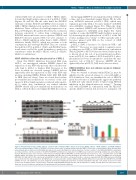
Figure 5. Phosphorylation status of MCL-1/BCL-2 correlates with sensitivity to MEK + histone deacetylase (HDAC) or BCL-2 + HDAC inhibition, and HDAC inhibition affects the phosphorylation of MCL-1. (A) Whole-cell lysates from a panel of human multiple myeloma (MM) cell lines were separated with sodium dodecylsulfate polyacrylamide gel electrophoresis (SDS-PAGE) and subjected to western blotting for the indicated proteins. Cell lines sensitive to the AZD6244/LBH589 combination are indicated in blue. Cell lines sensitive to the ABT-199/LBH589 combination are indicated in red. KMS11 was resistant to both drug combinations, and is indicated in black. Mutational status of the cell lines, either mutated or wild-type (WT) for RAS/RAF, is shown. (B) H929 was treated for 1, 6, 12, and 24 h with 5 and 10 nM LBH589. Whole cell lysates were separated with SDS-PAGE and subjected to western blotting for the indicated proteins. (C) H929 and MM1S were treated with AZD6244 (250 nM and 150 nM, respectively) and LBH589 (5 nM) for 24 h. Whole cell lysates from these cells were separated with SDS-PAGE and western blotting was performed for the indicated proteins. (D) KMS28 was electroporated with scrambled siRNA or BAX and BAK siRNA, then treated with 250 nM ABT-199 and 5nM LBH589. At 72 h, cell viability was assessed using flow cytometry by analyzing the proportion of annexin–/propidium iodide (PI)– cells, shown as percent of control on the Y-axis. In addition, whole-cell lysates were separated using SDS-PAGE and probed for the indicated proteins to confirm silencing. Error bars represent the stan- dard error of mean of triplicate experiments. All experiments were performed in triplicate.
haematologica | 2019; 104(10)
2069
