
Page 116 - 2019_10 resto del Mondo_web
P. 116
M. Chapellier et al.
To explore the biological mechanisms by which TNFSF13 promotes AML cells, we investigated whether TNFSF13 affects the apoptosis and cell cycle status of c- Kit+ leukemia cells. We found that TNFSF13 stimulation had an anti-apoptotic effect, with both early and late apoptotic cells being reduced (Figure 6A and B). The anti- apoptotic effects were also accompanied by an increase in actively cycling cells (Figure 6C and D). Collectively, these data indicate that TNFSF13 supports AML cells by sup- pressing apoptosis and promoting active cell cycle pro- gression.
TNFSF13 promotes human acute myeloid leukemia cells by suppressing apoptosis
To assess whether TNFSF13 also stimulates human AML cells, we analyzed the sensitivity of nine human myeloid leukemia cell lines to TNFSF13. Upon serum dep- rivation, we found that TNFSF13 significantly supported the growth and survival of six of the nine cell lines and TNFSF13 was confirmed to bind to the cell surface of the AML cells (Figure 7A and B and Online Supplementary Figure S6A and B). To efficiently bind to TNFRSF13B or TNFRSF17, TNFSF13 binds to heparan sulfate proteogly- cans (HSPG), which facilitates TNFSF13 oligomerization.18 In accordance with this, we detected expression of the proteoglycan SYNDECAN-1 (CD138) on Mono-Mac-6 cells (Figure 7C). Further, as previously described,18,19 the binding of TNFSF13 to HSPG was blocked by heparin (Figure 7D). Moreover, consistent with the effect observed on murine c-Kit+ leukemia cells, TNFSF13 stimulation sup- pressed apoptosis in the AML cell line Mono-Mac-6 (Figure 7E and Online Supplementary Figure S6C), but did
A
not significantly affect the cell cycle (Online Supplementary Figure S6D). In accordance with murine AML cells, TNFRSF13B was not expressed on human AML cell lines, whereas TNFRSF17 was detected on 3 of 9 of the myeloid leukemia cell lines by flow cytometry, and in 7 of 9 of cell lines by real-time PCR, albeit at low levels (Online Supplementary Figure S6E and H).
To investigate which of the two receptors is the most prominent on AML patient cells, we analyzed their expression pattern in AML patient data from the TCGA database.20 Similar to the c-Kit+ murine leukemia cells and human cell line data, TNFRSF17 was expressed at signifi- cantly higher levels than TNFRSF13B (Online Supplementary Figure S6I). In addition, we observed a high- er relative expression of both TNFRSF13B and TNFRSF17 in RUNX1-mutated (2.5- and 2.6-fold change, respective- ly) and TP53-mutated (3.5- and 3.2-fold change, respec- tively) AML patients, two genetic subtypes associated with a dismal outcome (Online Supplementary Table S5).21-23 These findings demonstrate that TNFSF13 also promotes human AML cells in vitro by suppressing apoptosis, and suggest that TNFRSF17 is the primary receptor for TNFSF13 on human AML cells.
TNFSF13B promotes proliferation of human acute myeloid leukemia cells
We also evaluated the role of TNFSF13B (BAFF) in AML, another ligand for TNFRSF17. TNFSF13B levels were approximately 100-fold lower than TNFSF13 levels in the mouse BM (Figure 3B and Online Supplementary Figure S7A), whereas similar levels of the two cytokines were
BCD
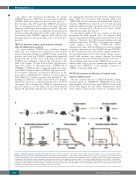
Figure 5. TNFSF13 supports leukemia development in vivo. A total of 250,000 c-Kit+ bone marrow (BM) cells from Tnfsf13-/- mice were transduced with a MIG-MLL-AF9 retroviral vector and transplanted into sublethally irradiated Tnfsf13+/+ and Tnfsf13-/- primary recipient mice (22 mice per group, pooled from four inde- pendent experiments). 1,000 leukemia cells harvested from spleens of primary recipients were transplanted into secondary recipient mice with matching genetic background. (A) Schematic picture showing the experimental setup. (B) Percentage of leukemic (GFP+) cells in the peripheral blood of the Tnfsf13-/- and Tnfsf13+/+ recipient mice 40 days after transplantation, normalized to the mean of the control (Tnfsf13+/+) group in each experiment. Horizontal lines show the mean values with- in groups. (C) Kaplan-Meier curves showing the survival of primary recipient mice. (D) Kaplan-Meier curves showing the survival of secondary recipient mice (6 mice per group; pooled data from 2 donors per group). *P<0.05; **P<0.01.
2012
haematologica | 2019; 104(10)
