
Page 103 - 2019_10 resto del Mondo_web
P. 103
sHLH in LPS-treated SAMP/TA-1 mice
A
B
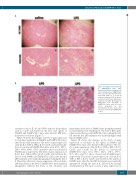
Figure 3. Changes in liver histology
in SAMP1/TA-1 mice lipopolysaccharide treatment. (A) Livers obtained from SAMP1/TA-1 mice 21 days after the first treat- ment with saline (a, c) or 25 μg lipopolysaccharide (LPS) (b, d) were sectioned and stained with hema- toxylin & eosin (HE). (B) Changes in high-power liver histology in SAMP1/TA-1 mice after LPS treat-
ment. Congestion (a) microthrombi (b) were observed in the livers of LPS-treated SAMP1/TA- 1 mice.
after
and
cytokines such as IL-10, and IFN-g-induced chemokines such as Cxcl9 and Cxcl10 in the liver and spleen of SAMR1 and SAMP1/TA-1 mice after the first LPS treat- ment were evaluated (Figure 7).
Figure 7A shows the changes in levels of gene expression for cytokines in the liver in SAMR1 and SAMP1/TA-1 mice after the first LPS treatment. The levels of gene expression of IL-1β, IL-6, TNF-α, IFN-g, IL-10, Cxcl9, and Cxcl10 in the liver of non-treated SAMP1/TA-1 mice were 401%, 253%, 146%, 380%, 694%, 353%, and 220% those of non-treated SAMR1 mice, respectively. The levels of gene expression of IL-1β, IL-6, TNF-α, IFN-g, IL-10, Cxcl9, and Cxcl10 in the liver of both SAMR1 and SAMP1/TA-1 mice after the first LPS treatment were markedly upregulated during the first 6 h. Thereafter, the levels of gene expression of the cytokines and chemokines in the liver of SAMP1/TA-1 mice remained upregulated, whereas the levels of the cytokines and
chemokines in the liver of SAMR1 mice promptly returned to pretreatment levels. Furthermore, the level of IFN-g gene expression in the liver of SAMP1/TA-1 mice during the first 6 h after the first LPS treatment was markedly higher than that in SAMR1 mice.
Figure 7B shows the changes in the levels of gene expression of cytokines in the spleen in SAMR1 and SAMP1/TA-1 mice after the first LPS treatment. The lev- els of gene expression of IL-1β, IL-6, TNF-α, IFN-g, IL-10, Cxcl9, and Cxcl10 in the spleen of non-treated SAMP1/TA-1 mice were 135%, 142%, 102%, 187%, 81%, 68%, and 71% those of non-treated SAMR1 mice, respectively. The levels of gene expression of IL-1β, IL-6, TNF-α, IFN-g, IL-10, Cxcl9, and Cxcl10 in the spleen of SAMR1 mice after the first LPS treatment were markedly upregulated during the first 6 h, followed by prompt downregulation. The time courses of gene expression of
haematologica | 2019; 104(10)
1999
