
Page 104 - 2019_10 resto del Mondo_web
P. 104
I. Tsuboi et al.
IL-1β, IL-6, TNF-α, IL-10, Cxcl9, and Cxcl10, but not IFN-g, in the spleen of SAMP1/TA-1 mice after LPS treat- ment were similar to those in SAMR1 mice. The level of gene expression of IFN-g in the spleen of SAMP1/TA-1 mice during the first 6 h after LPS treatment was marked- ly higher than that in SAMR1 mice.
Changes in the polarization of M1/M2 peritoneal macrophages in SAMR1 and SAMP1/TA-1 mice after the first lipopolysaccharide treatment
The polarization of M1/M2 peritoneal macrophages of SAMR1 and SAMP1/TA-1 mice after the first LPS treat- ment was evaluated. Figure 8 shows the changes in the
AB
CD
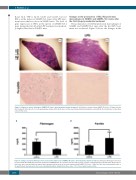
Figure 4. Changes in splenic histology in SAMP1/TA-1 mice after lipopolysaccharide treatment. (A-D) Spleens obtained from SAMP1/TA-1 mice 21 days after the first treatment with saline (A, C) or 25 μg lipopolysaccharide (LPS) (B, D) were sectioned and stained with hematoxylin & eosin (HE) (A, B) or Berlin blue to label triva- lent iron (Fe) (C, D).
AB
Figure 5. Changes in plasma fibrinogen levels and serum ferritin levels in SAMP1/TA-1 mice after lipopolysaccharide treatment. (A) Plasma fibrinogen levels were measured with ACL ELITE PRO in plasma obtained from SAMP1/TA-1 mice 21 days after the first injection of saline or 25 μg lipopolysaccharide (LPS). (B) Serum fer- ritin levels were evaluated with an enzyme-linked immunosorbent assay kit in serum obtained from SAMP1/TA-1 mice 7 days after the first treatment with saline or 25 μg LPS. Each bar represents the mean ± standard deviation obtained from three mice. *P<0.05 vs. saline-treated control.
2000
haematologica | 2019; 104(10)
