
Page 101 - 2019_10 resto del Mondo_web
P. 101
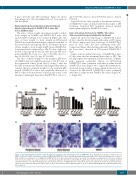
sHLH in LPS-treated SAMP/TA-1 mice
7 days after the first LPS treatment. Figure 1B shows hemophagocytic cells in peripheral blood, bone marrow, and the spleen.
Repeated lipopolysaccharide treatment induced hepatosplenomegaly in SAMP1/TA-1 mice but not in SAMR1 mice
The ratios of liver weight and spleen weight to whole body weight in SAMR1 and SAMP1/TA-1 mice after repeated LPS treatment were evaluated (Figure 2A). The ratio of liver weight to body weight in LPS-treated SAMR1 mice remained unchanged compared with that of the non-treated control group (day 0). In contrast, the ratio of liver weight to body weight in LPS-treated SAMP1/TA- 1 mice increased continuously to 385.8% that of the non- treated control group by day 21 after the first LPS treat- ment (SAMP1/TA-1; day 0 vs. day 7; P<0.001, day 0 vs. day 14; P<0.001, day 0 vs. day 21; P<0.001).
The ratio of spleen weight to body weight in LPS-treat- ed SAMR1 mice was slightly increased to 134.8% that of the non-treated control group (day 0) on day 7 after the first LPS treatment and remained unchanged thereafter. In contrast, the ratio of spleen weight to body weight in LPS- treated SAMP1/TA-1 mice was markedly increased to 548.2% that of the non-treated control group on day 7 and remained unchanged thereafter (SAMP1/TA-1; day 0 vs.
A
day 7; P<0.001, day 0 vs. day 14; P<0.001, day 0 vs. day 21; P<0.001).
Figure 2B shows a photograph of the spleens and livers of SAMP1/TA-1 mice on day 21 after the first saline or LPS treatment. Repeated LPS treatment induced marked hepatosplenomegaly in SAMP1/TA-1 mice.
Liver and spleen histology in SAMP1/TA-1 mice after repeated lipopolysaccharide treatment
Figure 3A shows liver histology of SAMP1/TA-1 mice 21 days after the first treatment with saline or LPS. Figure 3B shows high-power liver histology of SAMP1/TA-1 mice 21 days after the first treatment with LPS. Congestion (Figure 3Ba) and microthrombi (Figure 3Bb) in the liver were observed in LPS-treated SAMP1/TA-1 mice.
Figure 4 shows splenic histology of SAMP1/TA-1 mice 21 days after the first treatment with saline or LPS. The red pulp region was expanded, and the structure of splenic pulp appeared somewhat chaotic in LPS-treated SAMP1/TA-1 mice compared with that in saline-treated SAMP1/TA-1 mice (Figure 4A vs. Figure 4B). Furthermore, decreased tissue staining of hemosiderin (ferric iron) was observed in LPS-treated SAMP1/TA-1 mice compared with that in saline-treated SAMP1/TA-1 mice (Figure 4C vs. Figure 4D).
B
Figure 1. Repeated lipopolysaccharide treatment induced pancytopenia and hemophagocytosis in SAMP/TA-1 mice. (A) Numerical changes in white blood cell (WBC), red blood cell (RBC), and platelet counts in SAMR1 and SAMP1/TA-1 mice after treatment with lipopolysaccharide (LPS). Numerical changes in the counts of WBC (a), RBC (b), and platelets (c) in SAMR1 and SAMP1/TA-1 mice after repeated LPS treatment are shown. The samples of peripheral blood cells were obtained from non-treated control mice (day 0) and mice 7, 14, and 21 days after the first treatment with 25 μg LPS. Each bar represents the mean ± standard deviation obtained from three mice. (B) Hemophagocytosis in hematopoietic tissues of SAMP1/TA-1 mice after LPS treatment. A peripheral blood smear (a) and touch prepa- rations of bone marrow (b) and spleen (c) were made on day 7 after the first treatment with 25 μg LPS. Cells were stained with Wright-Giemsa, and hemophagocytosis was evaluated.
haematologica | 2019; 104(10)
1997
