
Page 81 - 2019_09-HaematologicaMondo-web
P. 81
A unique ABCB7-FECH-ABCB10 complex
Loss of Abcb7 altered cellular iron distribution and caused oxidative stress and apoptosis of erythroid progenitors
We investigated the consequences of loss of Abcb7 in developing G1-ER4 cells, which require large amounts of
iron inside mitochondria to support heme synthesis. We first analyzed changes in the activation of the iron responsive element (IRE)-binding activities of Irp1 and Irp2, which post-transcriptionally shape the expression of the mammalian iron metabolism proteome by binding to
C
D
E
F
H
I
ABG
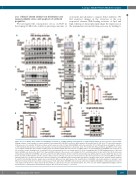
Figure 2. Loss of Abcb7 alters cellular iron distribution and leads to oxidative damage and apoptosis of erythroid progenitors. (A) Iron responsive elemebt (IRE)- binding activities of Irp1 and Irp2 in control and Abcb7-knockdown (KD) G1E-ER4 cells before differentiation (-β-estradiol) and 10, 24, 48 or 72 h after differentiation in the presence of β-estradiol. (B) In-gel aconitase activity assay on control or Abcb7-KD G1E-ER4 cells before and after 72 h of differentiation, showing the activities of mitochondrial and cytosolic aconitase (Aco2 and Aco1, respectively). Immunoblots to Irp2, Irp1, Aco2, Tfrc, ferritin (Ft), Hba-a2, Hbb-b1 and Mfrn1 on the same set of samples analyzed in the aconitase activity assays are shown. Tubulin (Tub) was used as a loading control. 55Fe autoradiogram on G1E-ER4 cells treated as for the aconitase assays, showing levels of radiolabeled iron incorporated into the iron storage protein Ft or into hemoglobin (Hb). (C) IRE-binding activities of Irp1 and Irp2 in G1-ER4 cells silenced for Abcb7 for 3 days and differentiated in the presence of β-estradiol for 72 h, and immunoblots to Irp2 and to Tub. (D) Protein levels of Irp2, Alas2 and Bach1 in G1E-ER4 cells before and 30 h after differentiation. (E) Iron content in mitochondria was significantly increased in Abcb7-KD (day 3) cells before (left lanes) differentiation. (F) The cytosolic labile iron pool (LIP) was decreased in cells treated as in (E). The mean fluorescence intensity (MFI) is shown in arbitrary units (a.u.). (G) Representative flow cytometry analysis to sort G1E-ER4 control or Abcb7-KD cells that were double-positive for the apoptotic marker (annexin V) and for mitochondrial reactive oxygen species production (Mitosox) (top, right square). (H) Quantification of G1E-ER4 cells double-positive for annexin V and Mitosox from data shown in (G). (I) In-gel activity assay of Sod1 and Sod2 in G1E-ER4 cells treated as in (E) showed significantly higher activity and protein levels in cells depleted of Abcb7 for 3 days. Data in (E) (F) and (H) are expressed as mean ± standard deviation. (A-I, n=5). See also Online Supplementary Figure S14 for densitometries of immunoblots and statistical analyses. NT: not treated (control). ***P<0.001
haematologica | 2019; 104(9)
1759
