
Page 131 - 2019_09-HaematologicaMondo-web
P. 131
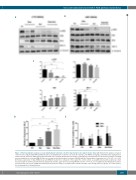
Glucocorticoids and selumetinib in RAS pathway-mutated ALL
A
B
C
DE
Figure 3. Pharmacodynamic analyses in acute lymphoblastic leukemia cells after drug dosing in vivo support in vitro data. (A,B) Western blot analyses of spleen cells from mice engrafted with RAS pathway-mutant acute lymphoblastic leukemia cells 72 h after dosing: L779; NRAS; 25 mg/kg selumetinib and 1 mg/kg dexam- ethasone bid (A) and L897; KRAS; 25 mg/kg selumetinib and 0.5 mg/kg dexamethasone bid (B). (C) Histograms of densitometry from western blot analyses, showing mean ± standard error of mean (SEM) (3-4 mice per treatment) [one-way analysis of variance (ANOVA) with the Tukey multiple comparison test, *P<0.05, **P<0.01]. (D) Relative expression of GILZ mRNA (mean and SEM) in treated mice compared to those given the control vehicle, as quantified by real-time polymerase chain reaction analysis in all three patient-derived xenograft experiments, again after 72 h dosing (ANOVA as before **P<0.01; ns, not significant. (E) Histograms of annex- in V-positive ALL cells (mean ± SEM) determined by flow cytometric analyses of peripheral blood at 24 h and 48 h after dosing (2 mice per group). CV: control vehicle; Sel: selumetinib; Dex: dexamethasone.
haematologica | 2019; 104(9)
1809
