
Page 84 - 2019_08-Haematologica-web
P. 84
N. Martínez-Calle et al.
satisfactory overexpression of the gene (Figure 3B-D). Rescue of ZFP36L1 expression resulted in a decrease of more than 50% in cell proliferation, alongside an increase of annexin V-positive cells as measured by flow cell cytometry (Figure 3E,F).
AB
Discussion
In the present study, we have extended previous knowl- edge regarding the DNA methylome in both primary and secondary MF, focusing specially on those CpG sites locat-
CDE
FGH
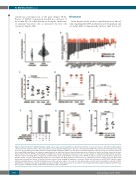
Figure 2. Aberrant enhancer DNA methylation regulates gene expression in myelofibrosis. (A) Violin density plots of expression of genes with differentially methylat- ed CpG located in enhancer regions. The vertical axis represents log fold change in gene expression. The horizontal width of the plot represents density of data along the y axis. (B) Candidate genes with substantial changes in DNA methylation (FDR <0.01 and Δβ>0.4) and differential gene expression (logFC<0). Red bars represent the average DNA methylation of all enhancer-mapped probes, the black bars represent the average expression of all probes, and the error bars represent the stan- dard deviation (SD) (C) ZFP36L1 downregulation validation by real-time quantitative polymerase chain reaction analysis of myelofibrosis (MF) patients and three myeloid cell lines (including SET-2) compared to healthy controls (n=3). (D,E) Bisulfite sequencing of the ZFP36L1 enhancer region (D) and promoter region (E) in healthy controls, cell lines and primary MF samples. For each sample, the graph shows the mean ± SD of ten CpG dinucleotides for enhancer regions and 15 CpG dinucleotides for promoter regions. (F) pCpG-L luciferase reporter assay showing the inhibition of luciferase activity after treatment of the ZFP36L1 enhancer region with Sss-I methyltransferase. (G) DNA methylation levels of the enhancer region – the same ten CpG dinucleotides as in (D) after 5-azacytidine treatment of SET-2. (H) ZFP36L1 expression levels after 5-azacytidine treatment of SET-2. Plots/bars indicate mean ± SD. FC: fold change; DMC: differentially methylated CpG; FDR: false discovery rate; CONTROL: healthy controls. MF; myelofibrosis; AZA: 5-azacytidine.
1576
haematologica | 2019; 104(8)
