
Page 82 - 2019_08-Haematologica-web
P. 82
N. Martínez-Calle et al.
lated CpG between post-ET and post-PV MF. However, both unsupervised principal component analysis (PCA) (Figure 1A) and hierarchical clustering studies (Online Supplementary Figure S1A) using all CpG analyzed con- firmed an explicit segregation and a clear epigenetic differ-
AB
ence between samples from patients with MF and those from healthy controls. These results allowed us hereafter to consider all MF samples as a single sample cohort.
Next, we sought to interrogate differences in DNA methylation between MF samples and healthy controls. In
C
D
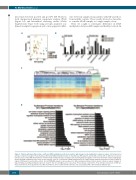
Figure 1. Patients with myelofibrosis have a different DNA methylation profile from controls, with changes located primarily in enhancer regions. (A) Unsupervised principal component analysis (PCA) showing a differential DNA methylation profile of myelofibrosis (MF) patients and healthy controls with no differences between primary and secondary MF. (B) Distribution of differentially methylated CpG according to CpG island mapping (left graph) or functional chromatin analysis (right graph) grouped by DNA methylation status of the probes (legend). *P≤0.05. (C) Heatmap of DNA methylation levels of differentially methylated CpG sites located in enhancer regions in MF patients and healthy controls. (D) GO-PANTHER analysis of genes adjacent to differenatially methylated CpG located in enhancer regions. Analysis of hypermethylated and hypomethylated genes is shown in the left and right panels, respectively. PC1: principal component 1; PC2: principal component 2; PMF: pri- mary myelofibrosis; PV: polycythemia vera; MF: myelofibrosis; ET: essential thrombocythemia; CGI: CpG islands; DMC: differentially methylated CpG.
1574
haematologica | 2019; 104(8)
